
An oscillating cart with a PocketLab provides an interesting way to study Newton's Second Law of Motion as well as some principles of damped harmonic motion. The apparatus setup is shown in the figure below. The small dynamics cart that can quickly be made from parts included in the PocketLab Maker Kit is shown in its equilibrium position. Rubber bands are attached to each side of the cart and to two ring stands weighted down with some heavy books. It is best to use rubber bands that provide as small Newton/meter as possible. PocketLab is attached to the cart with its x-axis parallel to the rubber bands.
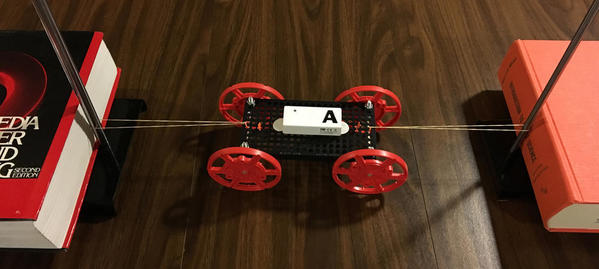
The close-up in the figure below shows that two small pieces of wire are threaded into holes in the cart with the rubber bands attached. The ends of each wire are twisted together to tighten the rubber band on the cart.

The movie below shows a typical run, with 20 data points per second and acceleration selected in single-graph mode. The red trace on the graph is the acceleration of interest, namely acceleration in the X-direction. The blue and green traces, representing acceleration in the Y and Z directions, are quite erratic due to slight jiggling of the cart, and are not of interest here. The red curve shows a very regular pattern, in which it can be observed that the magnitude of the acceleration is greatest when the cart is at each end of its swing and zero in the center of the swing. It is also noted that the magnitude of the acceleration decreases with time in a pattern that suggests exponential decay.
The image shown below contains a graph of x acceleration from data produced by the PocketLab app. The graph was obtained by importing data from the PocketLab app into Logger Pro, an exceptional educational scientific analysis software from Vernier Software & Technology (vernier.com). A model involving the sine function and exponential function was created. It is seen that the model (the black curve) follows the red acceleration X curve very well.
Students can therefore conclude that this oscillating cart has a negative exponential decay with individual cycles characteristic of the sine function. There are two constants of particular interest in the model equation shown in the gif image: Accel X = A*exp(-B*x)*sin(Cx+D)+E. The constant C in the fit is 2*Pi/Period, from which we see that the period is 2*Pi/D = 2*Pi/11.61 = 0.54 s. This agrees very well with the period obtained by direct observation of the graph. The constant B in the fit is the reciprocal of the so-called lifetime. Any exponential decay is characterized by its lifetime, which is the amount of time required for the amplitude to decay to 37% of its initial value.
By loading the cart with different masses and collecting PocketLab data on the resulting accelerations, students should be able to verify Newton's Second Law of Motion (Fnet = ma), showing that acceleration is inversely proportion to mass if the net force is held constant.
This experiment also provides a nice way to determine the period when the period of the oscillation is quite small, and difficult to measure with a stop watch.
