The yo-yo, a toy with an axle connected to two disks and string wound on the axle, has been of fascination to many for centuries. It also offers a perfect opportunity to study angular velocity when a PocketLab has been attached to it. A graph of angular velocity vs. time of a yo-yo will require students to think carefully about the detailed behavior related to its motion.
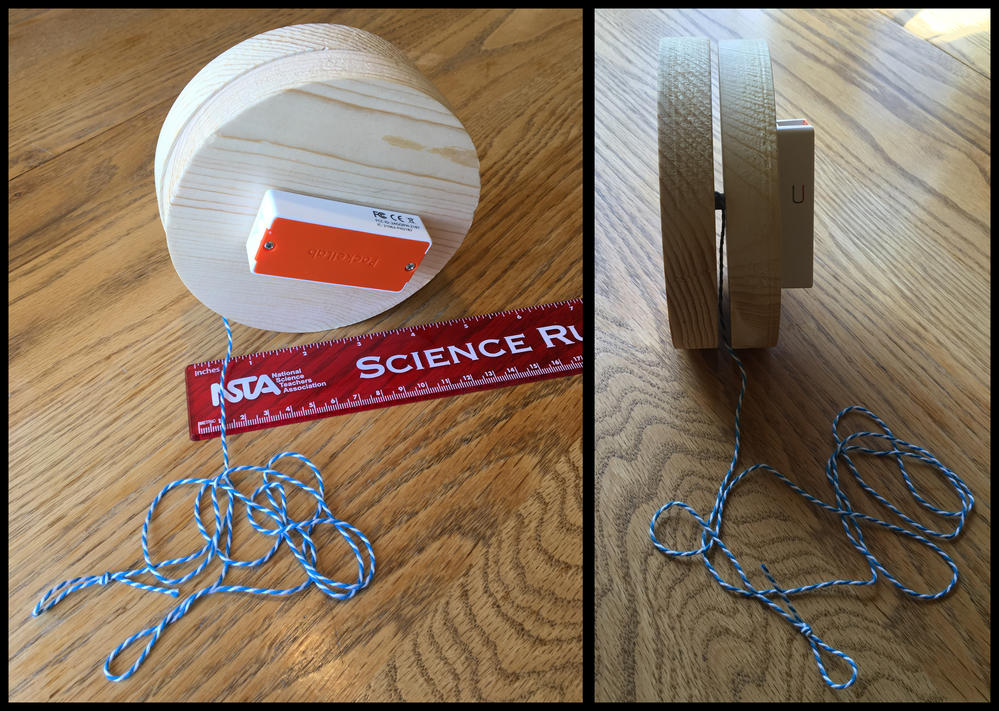
The author worked with a purchased $3 yo-yo, but found the results to be much clearer when attaching a PocketLab to a more substantial and heavier home-made yo-yo, as shown in the figure below. The photo on the left shows PocketLab attached to one of the two wood disks, each disk about five inches in diameter and 3/4" thick. The disks are connected with a short wood axle cut from a round dowel rod whose diameter is about 7 mm. The disks and dowel rods were purchased at a local Michaels hobby shop. The photo on the right shows the narrow gap between the disks with a string attached from the PocketLab Maker Kit. The end of the string has been pressed into the axle hole on the disk and is held tight by the axle, unlike most yo-yo's that you buy in the store. Store bought yo-yo's have the string tied to the axle loosely, so that all kinds of tricks can be performed by the practiced yo-yo-er.
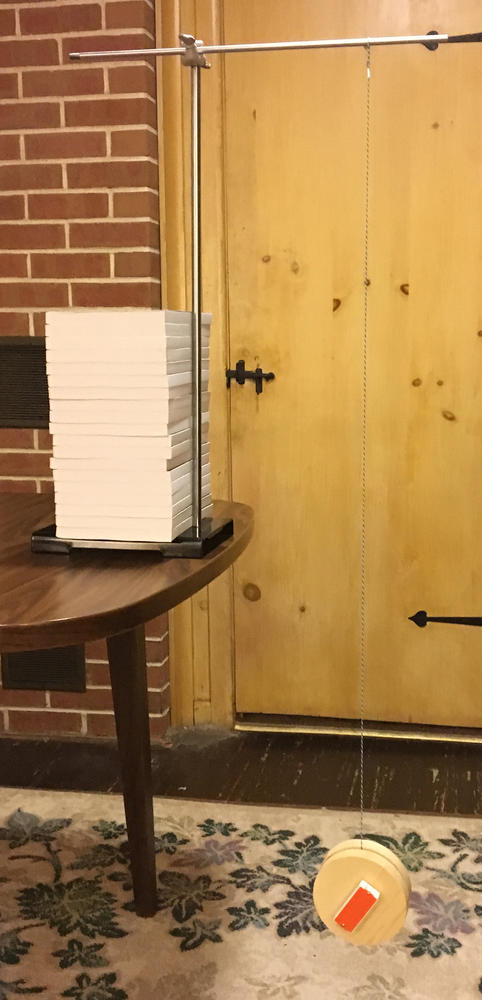
The photo below shows the apparatus setup. The free end of the string is looped over a rod attached to a ring stand. The yo-yo is then dropped and allowed to "yo-yo" up and down on its own until it stops. Based upon the orientation of the PocketLab app mounted on the yo-yo, the Z-angular velocity from the PocketLab app provides the data of interest in this study. The photo shows the yo-yo when it has come to rest after completely unwinding. The length of the string is about 1.1 meters.
The video below was taken with the PocketLab app superimposing angular velocity data and a graph. The data rate was set to the maximum allowed for angular velocity and the angular velocity was zeroed with the yo-yo at rest before taking the video.
The graph below was created in Excel from Z-angular momentum data from the PocketLab app. The gyroscope.csv file is attached for anyone interested in detailed data from the run. Several points and lines on the graph below have been labeled for the purposes of discussion and analysis. Students should be able to answer the questions after carefully viewing the video. (Teachers--see the attached Teacher Document.)
Discussion Questions
1. What is the yo-yo doing at the points labeled with green dots?
2. What is the yo-yo doing at the points labeled with red dots?
3. In contrast to the green dots, what has caused the horizontal lines which have been labeled with the letter A?
4. What is the yo-yo doing on the lines labeled with the letter B?
5. What is the yo-yo doing on the lines labeled with the letter C?
6. Can you think of a way to determine the actual maximum angular velocities where you see the horizontal lines labeled A?
The graph below was obtained by copying/pasting the Z-angular velocity data into Logger Pro, an exceptional educational software program for analyzing data, and a product of Vernier Software & Technology (vernier.com). It shows how the actual maximum angular velocities can be obtained where the horizontal lines labeled A are located. Linear models are simply applied to the data points on either side of the A lines. The intersection of these lines when extrapolated then tells us the actual maximum angular velocity. This process seems justified because of the triangular shape of the green point peaks on the right of the Excel graph, where angular velocity has not exceeded the maximum allowable by PocketLab, i.e., 2000 degrees/second.