Introduction to the Ideal Gas Law
The ideal gas law is commonly seen in the form PV = nRT, where P is the pressure, V is the volume, T is the absolute temperature, n is the amount of the gas in moles, and R is the ideal gas constant. It is a composite form of Boyle's, Charles's, Avogadro's, and Gay Lussac's laws. This law helps to explain how many things work, including bicycle pumps, hot air balloons, pressure cookers, and steam engines, just to mention a few.
The Lab Setup
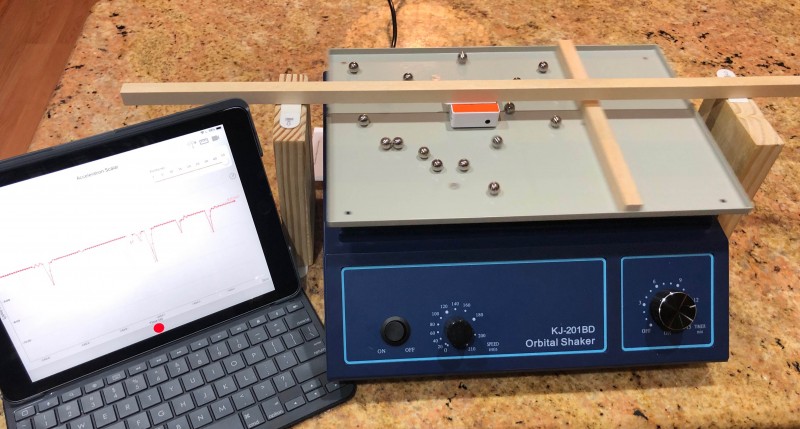
The ideal gas law is quite important as it is studied in both physics and chemistry courses. In this lesson we describe an experiment in which many aspects of the ideal gas law are verified for a "gas of steel balls" rolling randomly on an orbital shaker. The orbital shaker used by the author was purchased new for less than $80 on eBay. Similar orbital shakers are also available on Amazon as of the date of the writing of this lesson. The orbital shaker is variable speed--from 0 to 210 rpm. The variable speed feature is essential as it allows us to model different gas temperatures, with increasing orbital speeds making the steel balls move faster--representing a hotter gas. The 90-second video below is a must to view as it completely describes and explains the lab setup and presents graphs that summarize the major results.
As you have seen in the video, PocketLab Voyager's accelerometer plays a very important part in this lab. Voyager is solidly suspended from a wood beam so that it is about 2-3 mm above the orbital shaker's platform. This is done as we don't want to measure the acceleration of the orbital shaker. We only want to capture the scalar acceleration each time that a steel ball impacts Voyager. The steel balls used are 3/8" in diameter, so they impact Voyager's edges without going under Voyager. The number of impacts are counted for a 30 second interval for each run. The pressure of the gas of steel balls can then be expressed in units of "impacts per 30 second interval". The graph of Figure 1 provides an example of scalar acceleration data collected for a 30-second interval. The PocketLab data rate was set to the highest possible--50 points/second. Figure 1 clearly shows that the time between impacts is random.

Experiment Results
Figures 2, 3, and 4 are summaries of actual data obtained from this lab. It is amazing how the randomness of the motion of the steel balls verifies aspects of the ideal gas law. All of this is possible by carefully controlling variables as well as PocketLab's ability to capture information that allows determining the pressure! (All graphs were constructed with Excel.)
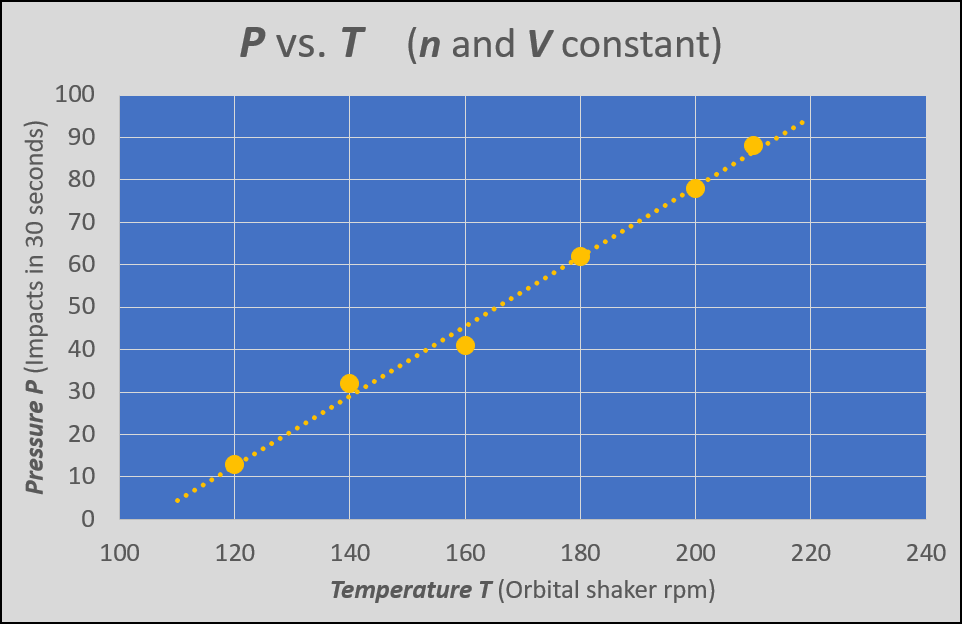
Figure 2 shows a graph of pressure P vs. temperature T, with the number of moles n and volume V kept constant. This is a representation of Gay-Lussac's Law--if a confined gas is kept at a constant volume, then increasing the temperature will result in an increase in pressure.

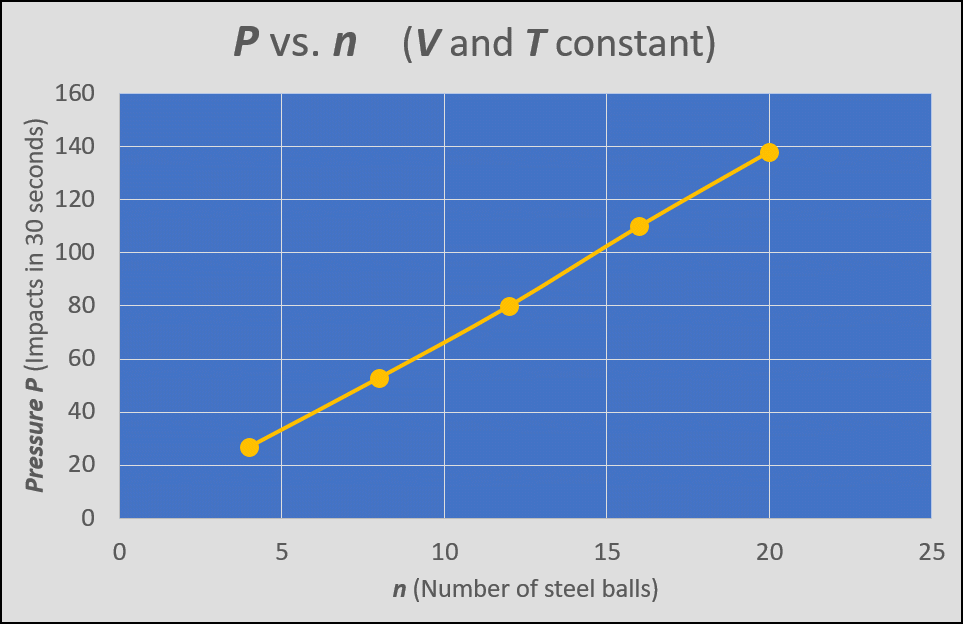
Figure 3 shows a graph of pressure P vs. amount of gas n, where the volume and temperature are held constant. When you go to the gas station to fill up tires with low pressure, you are increasing the amount of gas n--and this increases the pressure.

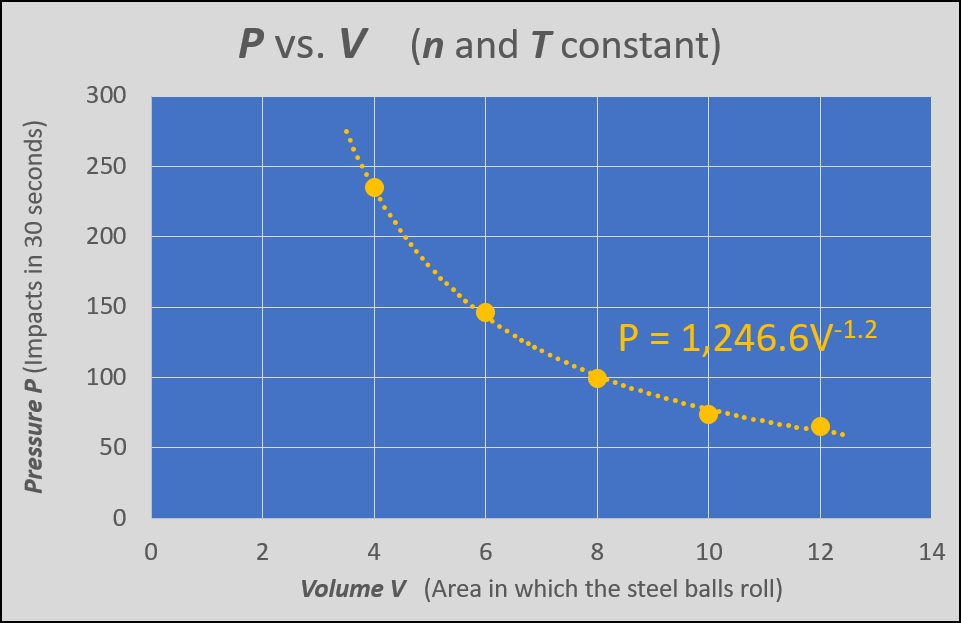
Figure 4 shows a graph of pressure P vs. volume V, where the amount of gas and temperature are held constant. This is a representation of Boyle's Law--pressure and volume are inversely proportional for a confined gas kept at constant temperature. Note that the best fit power curve indicates that the power is -1.2, close to the Idea Gas Law's -1 for an inverse proportionality.

Additional Lessons by the Author Dealing with Real Gases
Investigating Gay-Lussac's Law and Absolute Zero of Temperature with PocketLab and a Mason Jar
Investigating Boyle's Law with PocketLab
Additional Lessons by the Author Dealing with Randomness
LED Flame Lamp: Random or Cyclical Illumination?
Six Shades (not fifty!) of Grey: PocketLab Voyager/Scratch Dice

