Using PocketLab to Investigate Newton's Law of Cooling
In this experiment students will use PocketLab to collect data related to the cooling of a container of hot water as time goes on. Sir Isaac Newton modeled this process under the assumption that the rate at which heat moves from one object to another is proportional to the difference in temperature between the two objects, i.e., the cooling rate = -k*TempDiff. In the case of this experiment, the two objects are water and air. Newton showed that TempDiff = To * exp(-kt), where TempDiff is the temperature difference at time t and To is the temperature difference at time zero.
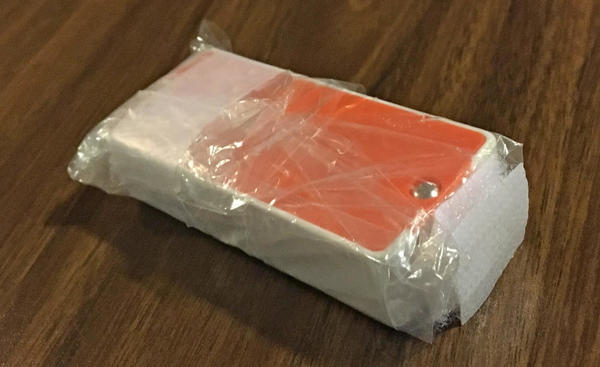
In order to do this experiment on Newton's Law of Cooling using PocketLab, we need to wrap PocketLab securely in a plastic sandwich bag, so that water cannot leak into the bag and damage PocketLab. The figure below shows how this can be done. PocketLab is wrapped and taped tightly in the plastic bag. It is immersed in water briefly to make sure that it has no leaks. A piece of Velcro is attached as shown on the right of the figure. The purpose of this Velcro is so that PocketLab can then be secured to the bottom of the hot water container without floating.
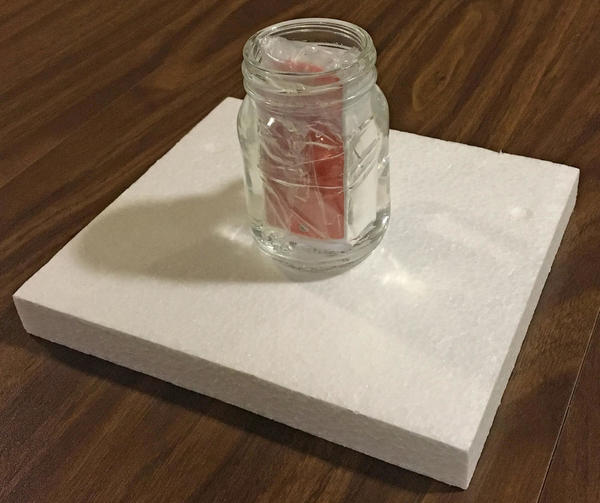
The figure below shows the complete apparatus setup. PocketLab has been placed and secured to the bottom of a small bottle not much larger than PocketLab. The bottle needs to be as small as possible, for even a small amount of water in the bottle can take several hours to cool back down to near room temperature again. The bottle used by the author required only about 70 ml of water, but data was collected for close to two hours. The room temperature is noted, hot tap water is poured into the bottle until it is full, and data collection is initiated with PocketLab set to record temperature once each second. The purpose of the optional small block of foam is to insulate the bottle some from the table top, resulting in most heat loss into the air.

The image shown below contains a graph of temperature from data produced by the PocketLab app. A red dot is shown once for every two-hundred data points. The graph was obtained by importing data from the PocketLab app into Logger Pro, an exceptional educational scientific analysis software from Vernier Software & Technology (vernier.com). The initial rise in temperature is due to the time required for PocketLab to warm up as heat is transferred from the water to PocketLab. Once equilibrium has been reached, the system begins to show cooling as heat is transferred to the surrounding air at room temperature. The cooling appears to be negative exponential. The model fit Temperature = A*exp(-Cx)+B was then applied to the region of the graph shown in dark gray. The correlation coefficient of 1.000 clearly indicates an excellent fit. x corresponds to time in Newton's equation, A to the initial temperature difference, C to the constant of proportionality k, and B to room temperature.