The Negative Exponential Nature of Damping
Introduction
Damping causes oscillatory systems to dissipate energy to their surroundings. Frictional losses are quite common in mechanical systems. For example, when a child stops pumping a swing, the amplitude of the oscillations gradually decay toward zero. The same thing happens to a mass that hangs from an oscillating spring. It is quite common for the amplitude of such oscillations to exhibit a behavior that is negative exponential over time, as shown in Figure 1. The graph indicates that if we take the amplitude at time t=0 to be 1, then the amplitude at time t=1 is 1/e (0.37) of its value at time t=0. In other words, the amplitude decrease by 37% of its current value every 1 unit of time. For example, at time t=2, the amplitude would be 0.37 x 0.37 = 0.137 arbitrary units. At time t=3, the amplitude would be 0.137 x 0.37 = 0.05 arbitrary units. The time interval τ during which the amplitude drops to 1/e of its initial value is known as mean lifetime of the oscillation.
Our Exponential Damping Experiment
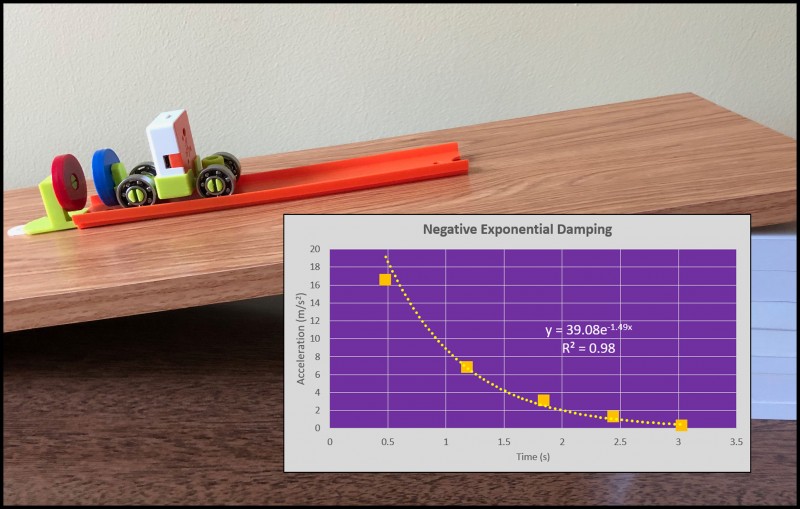
Because exponential damping is so common, many experiments can be designed to study it. In this lesson, we will make use of a PocketLab Mini HotRod and the PocketLab TurboTrack kit. Figure 2 shows the experimental setup. A small wood board and several books are used to create a ramp. A track connector end stop with a magnet holder is mounted to one end of a piece of Hot Wheels track. A magnet bumper is attached to a Mini HotRod. A magnet is then attached to the bumper so that the two magnets will repel one another. A 3M damage-free hanger attaches the end stop to the wood board so that the track will not slip. Voyager is inserted into the HotRod as shown in the Figure.

Performing the Experiment
Probably the best way to learn how to perform the experiment is to observe the short (7 seconds) video below. The HotRod is initially at rest at its equilibrium position. The HotRod is pulled to the right, held steady for a second or two and then released. Be careful not to pull it back too far, as you don't want the two magnets to touch one another, just to bounce off magnetically. The video and the data from the PocketLab app on the iPad clearly show that there is damping, as the maximum acceleration of each successive bounce decreases. The student's job is to show that the damping is, in fact, negative exponential.
Analysis
Figure 3 contains an Excel graph of raw data from the PocketLab app. Because of the fact that the ramp is at an angle, the z-acceleration when the HotRod is at rest at its equilibrium position is not zero - it is about 1.55 m/s/s. In fact, if the ramp was vertical, then the z-acceleration would be shown as 9.8 m/s/s. So, we need to subtract 1.55 m/s/s from the z-acceleration for all of our data. We also want to adjust the zero for time to be the instant at which the HotRod is released from rest at the high point on the ramp.
Upon adjusting the z-acceleration and setting the proper zero time, we obtain the graph shown in Figure 4. In order to determine if the damping is negative exponential, we need to determine the (time, acceleration) coordinates for each of the spikes in the graph. They are shown in red in the graph of Figure 4.
Finally, we make an Excel graph of adjusted acceleration vs. adjusted time, as shown in Figure 5. The trend line feature of Excel is used, and exponential is selected. The fit appears good and has an R-squared value of 0.98. The graph provides solid evidence that the acceleration experiences negative exponential damping as the PocketLab HotRod bounces magnetically. It is a good idea to have the class suggest what non-conservative forces are responsible for this damping. Which of these forces are likely the biggest contributors to the damping?
In general, y = Ao exp(-Ct), where Ao is the initial amplitude. In the graph of Figure 5, Ao = 39.08 and C =1.49. Have your students prove that the mean lifetime τ = 1/C. (Hint: take the natural log of both sides of the equation y = Ao exp(-Ct). In the graph of Figure 5, the mean lifetime is τ = 1/C = 1/1.49 = 0.67 seconds. The amplitude drops by 1/e of its current value every 0.67 seconds.