The CloudLab Model
CloudLab Introduction
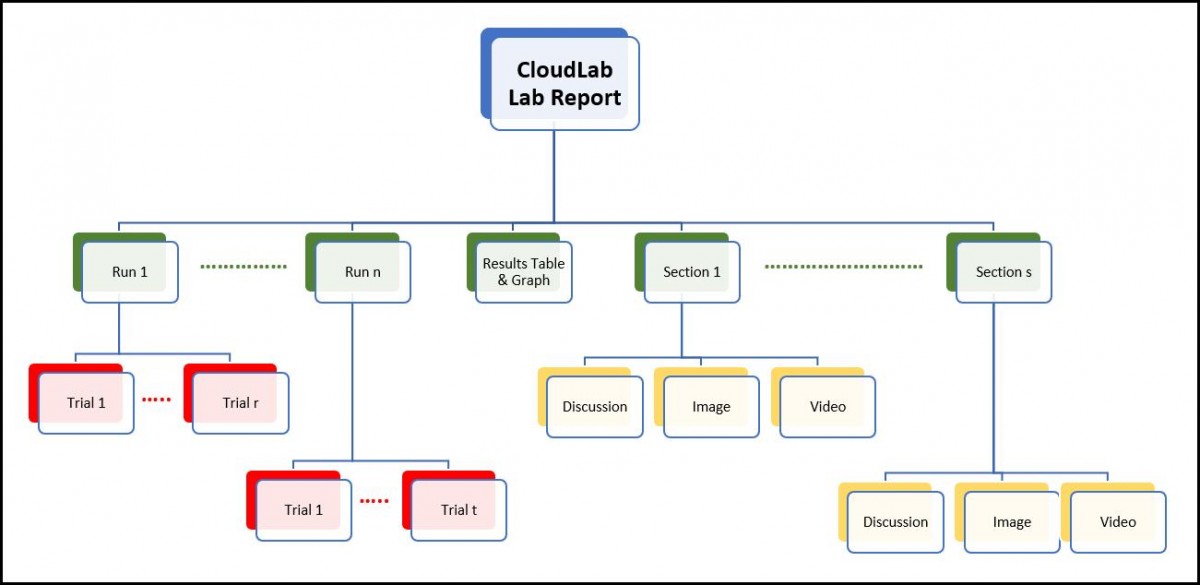
The purpose of this article is to provide the reader with an understanding of the CloudLab model for performing experiments with PocketLab sensors. Teachers can set up accounts and populate those accounts with their students. CloudLab is an online foundation allowing students to perform, analyze, document and save PocketLab lab reports. The figure below shows the basic hierarchical structure of CloudLab.
 Lab Report
A CloudLab lab report is at the root of the hierarchy. It can be an experiment on virtually anything that can be measured with PocketLab sensors—perhaps a study of circular motion with a PocketLab One gyroscope, or humidity with PocketLab Weather, or terminal velocity of an object falling in air with PocketLab Voyager’s IR rangefinder. Examples are limited only by one’s imagination and creativity.
Run
The next level shows that among other things, a CloudLab lab report consists of any number of runs. Each run represents a specific value for the independent variable in an experiment. For example, with PocketLab One, one run might represent a specific value for the radius of curvature in a study of circular motion, while another run would represent a different radius of curvature. Radius would be the independent variable. For PocketLab weather, one run might be a 5-minute collection of humidity data during an approaching storm, while the next run would be data for the next 5-minute interval, and so on. Here, the independent variable is time. For PocketLab Voyager, a run might be rangefinder data that records the position of a piece of cardstock paper as it falls onto Voyager. Another run might be similar data after the piece of cardstock has been folded in half. A third run collects data after folding the cardstock in half once again. In this case, the independent variable is the area of the falling cardstock.
Trial
Each run consists of any number of trials. A trial is a single recording of PocketLab sensor data that is uploaded into a specific run in a CloudLab lab report. For example, with PocketLab One, data from several trials might be collected and uploaded to a run representing a specific radius of curvature for a circular motion study. Data from another group of trials would be uploaded to a run representing a different radius, and so on for each value of the independent variable radius. With the PocketLab Weather study of humidity during an upcoming storm, each run would consist of just one 5-minute trial of humidity data. With the PocketLab Voyager study of the effect of area on terminal velocity, several trials of rangefinder data might be collected for each of the cardstock areas.
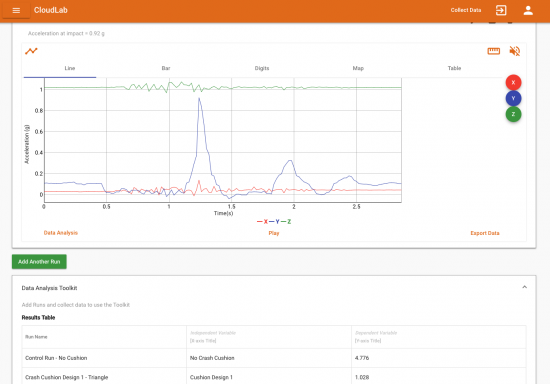
For each trial, the student can perform data analysis of the recorded data. If desired, the student can highlight and select a range of data points in the trial and analyze just the selected data. The data analysis will automatically calculate statistics including mean and standard deviation, available for further analysis. The data analysis can also include curve fitting if desired, including exponential, linear, logarithmic, polynomial, and power. With curve fitting, parameters describing the fit are available for further analysis.
Results Table and Graph
CloudLab then averages the statistic or curve fitting parameter selected by the student for all trials in each of the runs. These means then automatically populate the values for the dependent variable in the results table and graph, unless the student elects to do so manually.
A data analysis can also be performed on the results table and graph. Probably the most common analysis here would be to perform a curve fit for the results graph. For example, if the curve appears to be a power relationship, a curve fit analysis would provide a value for the power and display the fit curve along with the actual data. The student can select a bar chart as an alternative to a line chart if desired.
Section
The student can add any number of sections to a lab report. Each section is given a name by the student. The name can be anything that the teacher requests or the student wishes to include. Typical examples for section names might be Hypothesis, Procedure, Error Discussion, Conclusions, and Suggestions for Further Study. Each section includes discussion as well as an optional image and video.