
What causes the seasons on Earth?
Background Information
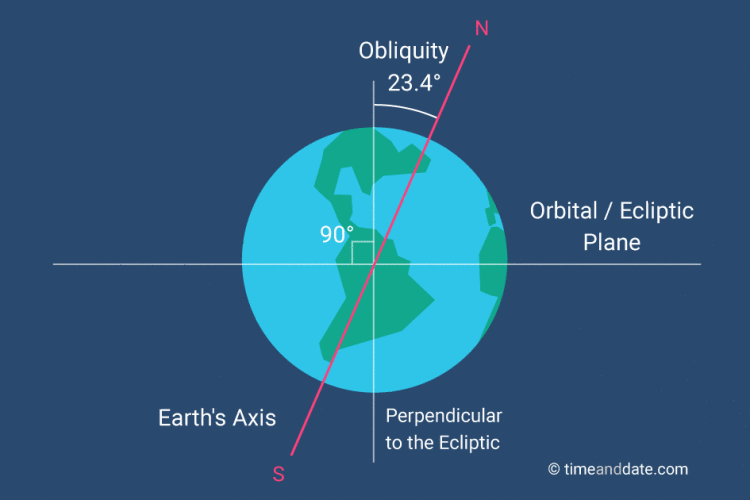
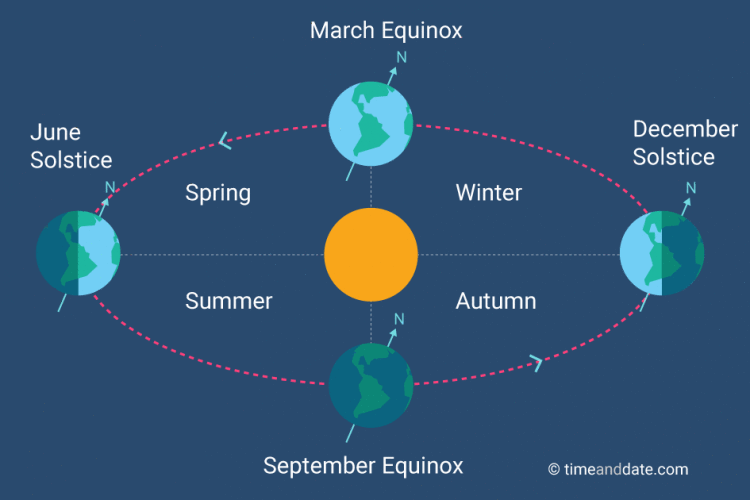
Weather is always changing. Humans have been dividing up the year based on these changes in weather for thousands of years. A division of a year based on weather is called a season. Different regions of the Earth have different names for seasons and different types of seasons. The most common seasonal names used are Winter, Spring, Summer, and Fall. These changes in weather from one season to the next are caused by Earth’s orbit around the Sun, and the tilt of Earth’s axis, as seen in the diagram below. In this lab activity, you will investigate what causes the seasons to change. You will use PocketLab Voyager or PocketLab Weather’s light sensor and attachable temperature probe to investigate how exactly Earth’s orbit, combined with Earth’s tilt on its axis results in changing weather patterns, and how that gives us the seasons commonly referred to as Winter, Spring, Summer, and Fall.

Objective
In this experiment, students will:
-Using background knowledge and a reading of the introduction, write a hypothesis that predicts why Earth’s weather changes causing the different seasons.
-Investigate their hypothesis/the cause of the season by gathering evidence/data using PocketLab Voyager or PocketLab Weather’s light sensor, and other materials.
-Refute common misconceptions about the cause of seasons using evidence/data collected during the experiment and scientific reasoning.
-Draw conclusions about the cause of the seasons, including how seasonal changes might differ depending on geographic location, using evidence/data collected during the experiment and scientific reasoning.
Materials
-PocketLab Voyager or PocketLab Weather (with an attachable temperature probe)
-PocketLab App with a compatible device
-Globe with approximately 23.4-degree tilt
-A light source (lamp with 150-watt bulb)
-Tape
-Meter stick or measuring tool
Hypothesis
Write a prediction to answer the following question:
What causes the changes in weather every season? Explain your hypothesis with either background knowledge about the weather or information gathered in the introduction and diagram above.
In today’s lab activity, we will test to see whether your hypothesis was correct.
Part 1: Collecting Data as a Group with PocketLab
In part 1 of the lab activity, your group will collect data using PocketLab Voyager/Weather and the PocketLab app (The screenshots were taken using the PocketLab web app. The PocketLab mobile app will look slightly different). Follow the steps below:
-Go to the PocketLab web app (in a Chrome browser) using the following address: thepocketlab.com/app or open up the PocketLab mobile app.
-Turn on the PocketLab Voyager/Weather by clicking the button on the top.
-If using the web app, click the text that reads, “Click here to connect”. If using the mobile app, the PocketLab Voyager/Weather should automatically connect.
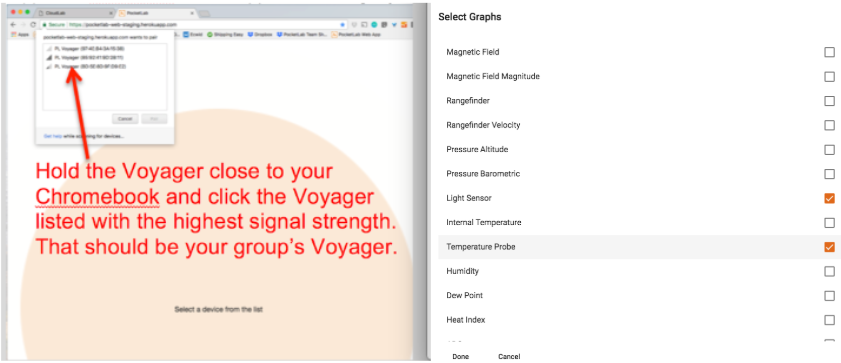
-Web app only: A pop-up box should appear showing all the PocketLab Voyagers/Weathers that are turned on. Hold your PocketLab Voyager/Weather close to your computer/Chromebook. Click the PocketLab Voyager/Weather with the highest “signal strength.”
-Click on the “Change Graph” icon. Click “Light Sensor” and “Temperature Probe” and unclick “Acceleration.”
Background information on Earth's orbit around the Sun and how it relates to seasons (all information is for the Northern Hemisphere)
-Earth is tilted on its axis approximately 23.4°.
-The Earth’s Equator is a line of latitude that separates the Earth into two halves, the Northern Hemisphere and the Southern Hemisphere.
-There are two other important lines of latitude, besides the Equator, that are important to understanding Earth’s seasons: The Tropic of Cancer and the Tropic of Capricorn.
-The Tropic of Capricorn is 23.26° south of the Equator.
-The Tropic of Cancer is 23.26° north of the Equator.
-On the first day of Fall and Spring, the sun is shining directly over the Earth’s Equator. This is called the Fall Equinox and Spring Equinox.
-On the first day of Winter, the sun is shining directly over the Tropic of Capricorn. The tilt of the Earth means the North Pole is pointing away from the Sun. This is called the Winter Solstice.
-On the first day of Summer, the sun is shining directly over the Tropic of Cancer. The tilt of the Earth means the North Pole is pointing toward the Sun. This is called the Summer Solstice.
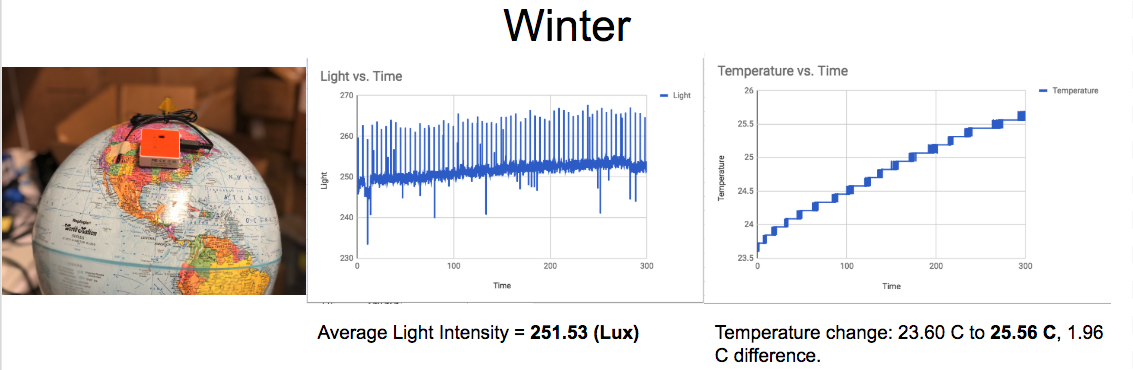
Data Collection for Run 1: Winter
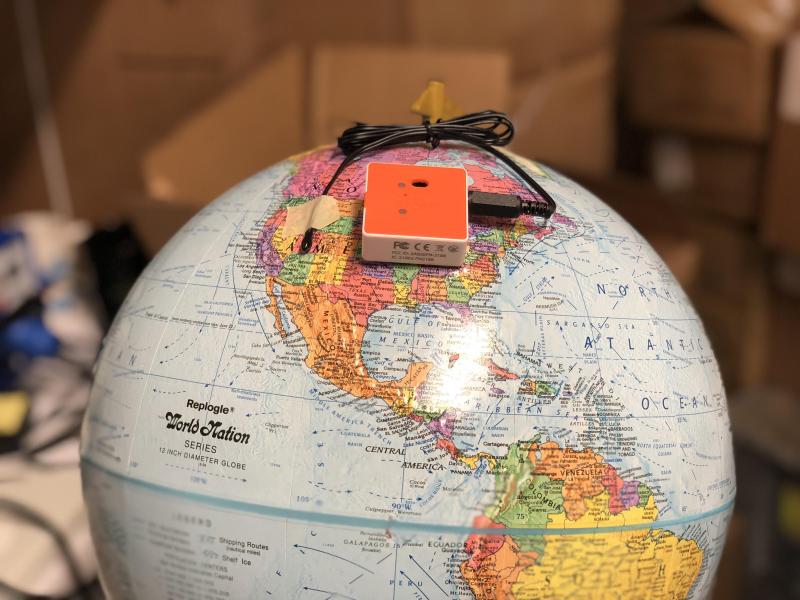
-Tape the PocketLab Voyager/Weather to a location in the Northern Hemisphere. If you live in the Southern Hemisphere, reverse these directions.

-Plug in the external temperature probe and tape the end of the probe so the bead of the probe is touching the surface of the globe and is close to the Voyager/Weather.
-Bring the heat lamp close to the globe and adjust its height and orientation so the middle of the bulb is directly over the Tropic of Capricorn in the Southern Hemisphere. The North Pole on the globe should be pointing away from the lamp.
-Slide the lamp back on the desk, keeping it aligned with the Tropic of Capricorn, until the bulb is 45 cm away from the bottom of the PocketLab Voyager (tip: the longer PocketLab USB cables are exactly 90 cm. Fold them in half and use them as an easy measuring device. If not, cut a string to 45 cm. It will be much easier than trying to use a meter stick).
-In your lab notes, right down the approximate temperature probe reading before you turn on the light and begin recording.
-Turn the lamp on.
-Immediately begin recording temperature probe and light intensity data.
-Record data for approximately 5 minutes/300 seconds.
-Hit stop, then turn off the heat lamp.
-Save your data as a .csv file.
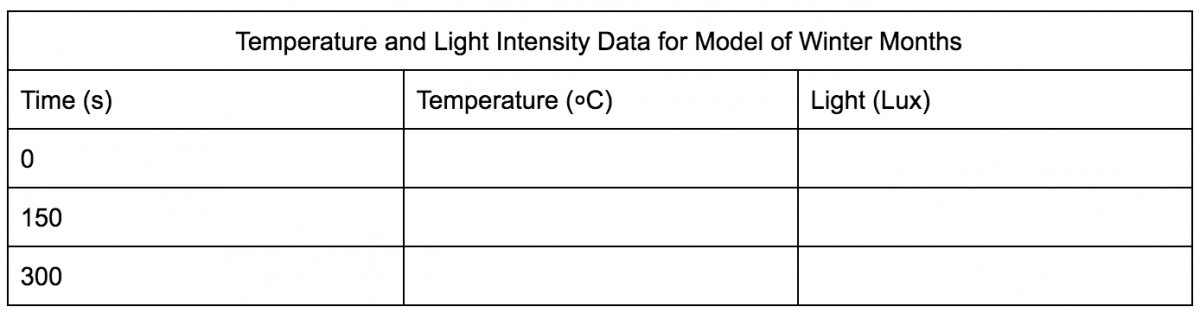
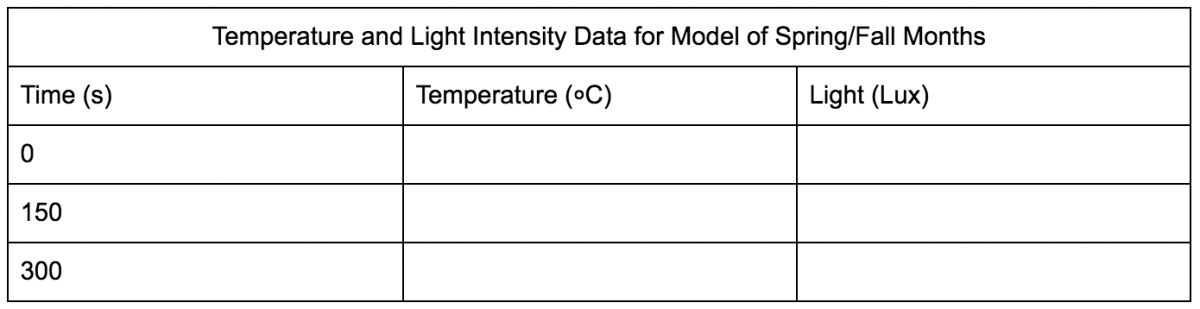
-Fill out the table below:
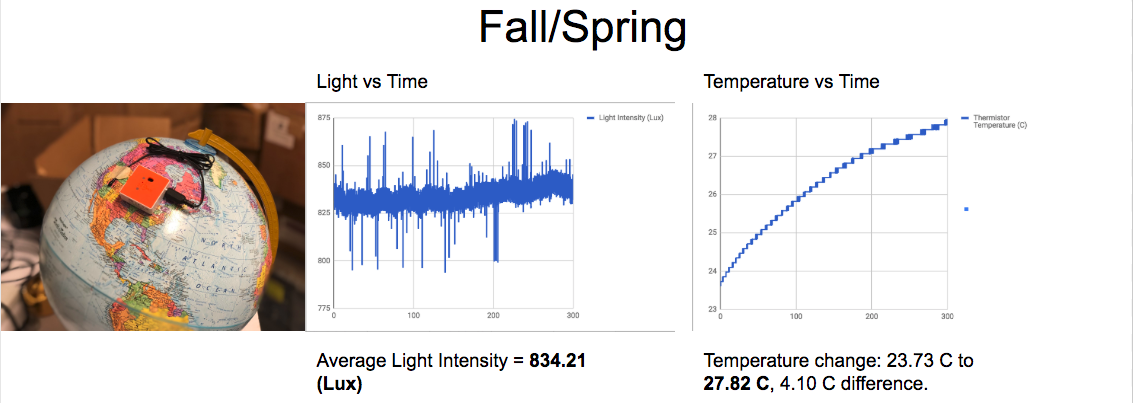
Data Collection for Run 2: Spring/Fall
-Follow the same steps as listed in Run 1: Winter, but change the orientation of the globe and the lamp so that the lamp is now directly over the Equator instead of the Tropic of Capricorn. The North Pole on the globe should not be pointing at the lamp but not directly away from the lamp. It should be pointing off to the side, perpendicular to the direction the lamp is facing.
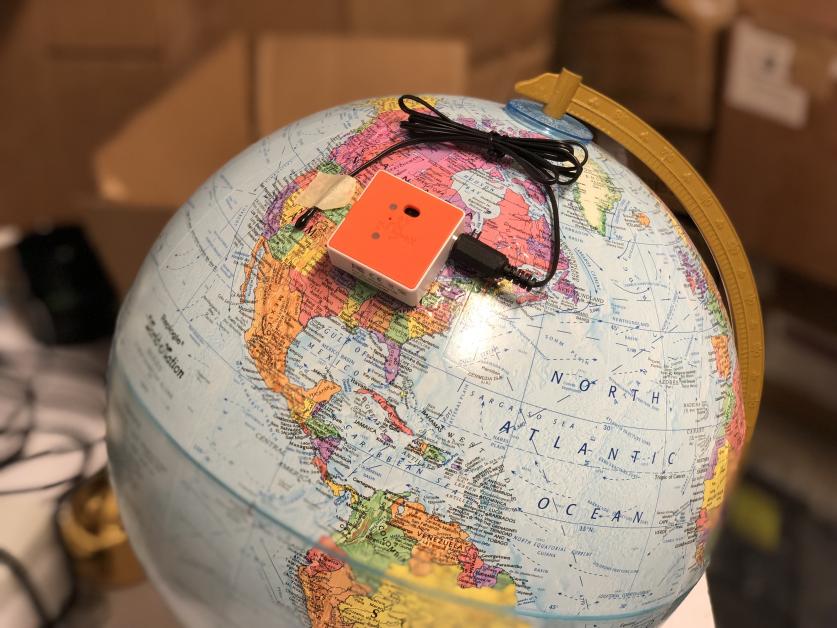
-Still make sure the PocketLab Voyager is 45 cm from the center of the bulb.
-Before recording, or turning on the lamp, monitor the temperature probe data. Allow the temperature probe time to settle back down to the original temperature you wrote down before you began recording Run 1. You’ll want all of the runs to start at approximately the same temperature reading.
-When you’re ready, turn on the lamp.
-Immediately begin recording temperature probe and light intensity data.
-Record data for approximately 5 minutes/300 seconds.
-Hit stop, then turn off the heat lamp.
-Save your data as a .csv file.
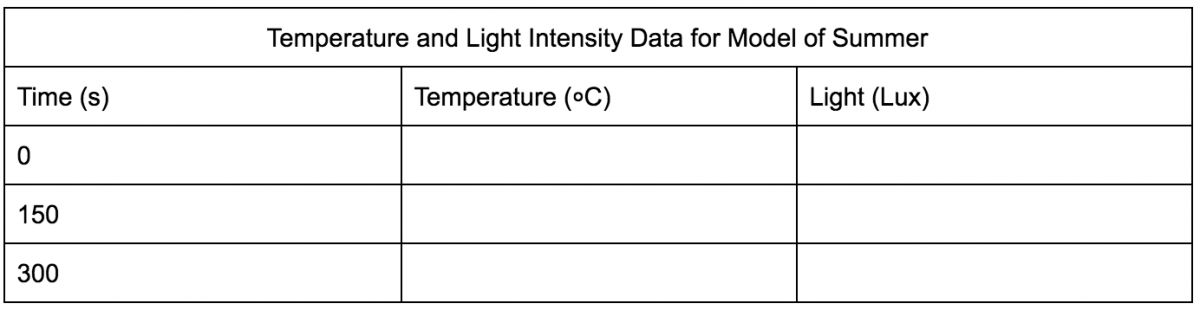
-Fill out the table below:
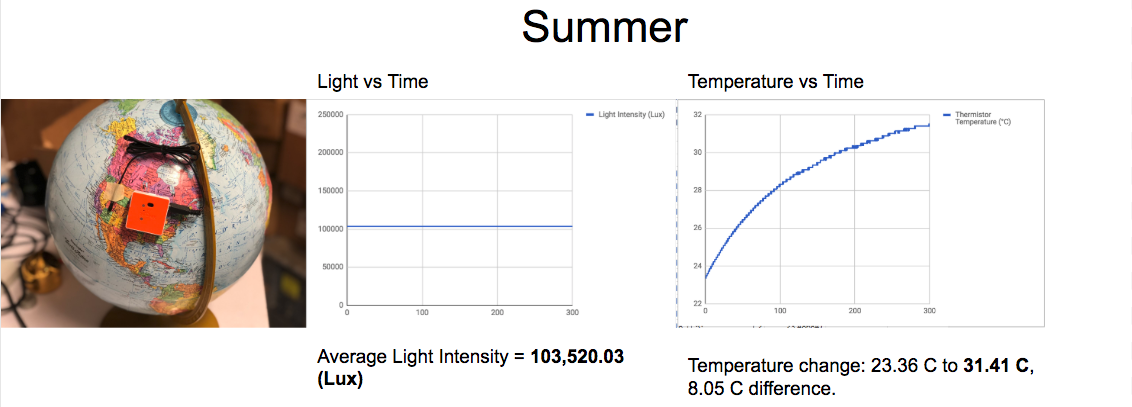
Data Collection for Run 3 Summer
-Follow the same steps as listed in Run 1: Winter and Run 2: Spring/Fall but change the orientation of the globe and the lamp so that the lamp is now directly over the Tropic of Cancer in the Northern Hemisphere. The North Pole on the globe should now be pointing directly at the lamp.
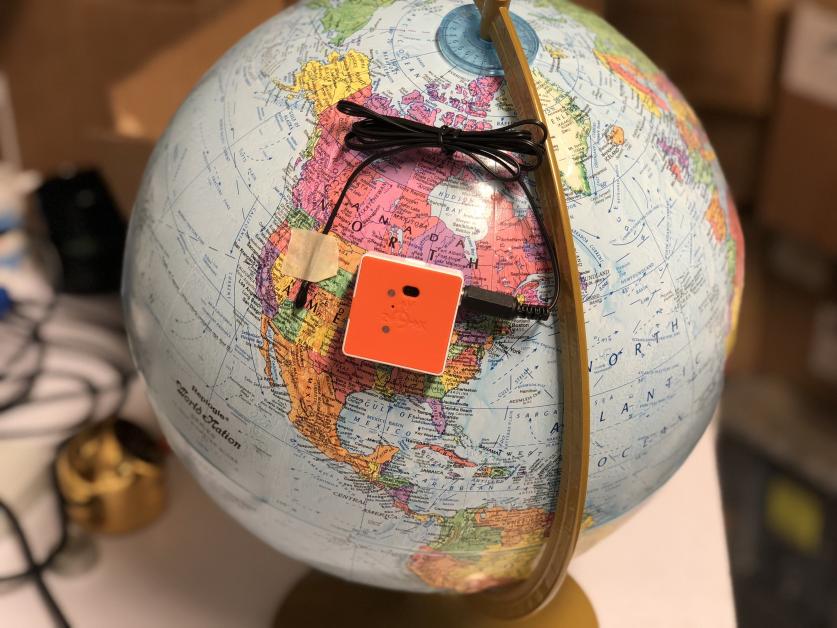
-Still make sure the PocketLab Voyager is 45 cm from the center of the bulb.
-Before recording, or turning on the lamp, monitor the temperature probe data. Allow the temperature probe time to settle back down to the original temperature you wrote down before you began recording Run 1. You’ll want all of the runs to start at approximately the same temperature reading.
-When you’re ready, turn on the lamp.
-Immediately begin recording temperature probe and light intensity data.
-Record data for approximately 5 minutes/300 seconds.
-Hit stop, then turn off the heat lamp.
-Save your data as a .csv file.
-Fill out the table below:
Data Analysis
-Find and compare the changes in temperature for all three runs.
-Compare how direct the sunlight was in each of the three seasons? Explain your answer with data/evidence collected from the experiment.
-As you and your group changed the seasons of the globe, describe how the orientation of the PocketLab compared with the lamp changed.
-In this experiment, did the actual distance between the PocketLab and the lamp change between seasons?
Part 2: Conclusion and Lab Report
Option 1: Write a concluding paragraph that answers the Conclusion Questions at the bottom of the page.
Option 2: Write a full lab report for this lab activity. A lab report is a great way to summarize how you conducted your experiment and tested your hypothesis, the data collected, and any conclusions you can draw about the scientific question that was tested.
In your lab report include:
1. Your original hypothesis from the beginning of the lab (in this case a description of your sketches).
2. The objectives or scientific questions you wanted to answer with the lab activity.
3. What materials you used in the experiment.
4. A detailed description of how the lab was set up and how you tested your hypothesis.
5. A summary of your data and the answers to your data analysis questions.
6. Any observations you made with your group.
7. A conclusion that answers the Conclusion Questions below.
Conclusion Questions
-Look back at your hypothesis from the beginning of the lab. Was your hypothesis was valid or invalid? Why or why not? Support your answer with data/evidence collected from the lab experiment and scientific reasoning about what you now think causes the seasons.
-Many people, well-educated adults included, have a big misconception about what causes the seasons. Think about the answers to your three data analysis questions to answer these two questions. 1) What do you think causes the temperature change during different seasons? 2) What do you think is the major misconception that many people have about the cause of the temperature change during different seasons?
-How do you think seasons are different for those living on the Equator compared to those living further north or further south on the Earth? Explain.
-In the Northern Hemisphere, how do you think seasons are different for those living very close to the North Pole compared to those living further south?
-If the Earth was tilted on its axis 35° how would this affect the seasons? Explain your answer using evidence collected from the lab activity.
-If the Earth was not tilted on its axis at all, how would this affect the seasons? Explain your answer using evidence collected from the lab activity.
Teacher Example Data