
You don't need an expensive air track to do a quantitative study of momentum, impulse, and force involved in the collision of two carts. You can get very good results by the use of two PocketLabs, two iPhones, and a pair of carts from the PocketLab Maker Kit.
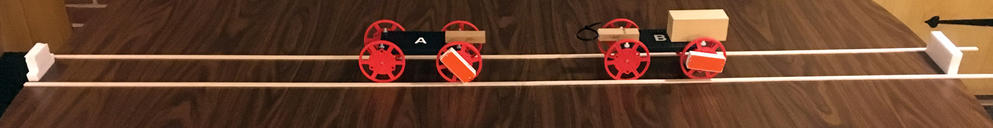
As shown in the picture below, each cart has a PocketLab mounted on one of its wheels, so that the z-axis is the axis of interest when the carts are moving. You can only connect one PocketLab to an iPhone at time, thus the need for two iPhones, each running the VelocityLab app. Since we are interested only in velocity, it really makes no difference where on the track the zero position is for each of the carts. The track, made from a pair of rails with inside separation just a little larger than the axle of the carts, was constructed with thin balsa wood sticks. This helps to keep the carts on "the straight and narrow" as they move. Styrofoam bumpers at the ends of the tracks keep the carts from falling off of the table. The collision is buffered by an 8" cable tie that is stuck (using thick double stick mounting tape) to one of the wood blocks that have been taped to each cart. Cart B has a larger extra block of wood taped to it to give it higher mass. The carts are given initial pushes in any direction desired. The VelocityLab apps will display movement to the right as positive velocity and movement to the left as negative velocity. The velocity graphs will likely not be synced in time, as it is quite difficult to start the VelocityLab apps on both iPhones at exactly the same time. But this is OK, as we only need to know the initial and final velocities as well as the difference between end and start times for the collisions. Knowing these things will allow us to compute impulse and momentum changes as well as the average force during the collision.
The Excel table in the figure below provides all of the detailed calculations for four different scenarios for cart A and cart B. All of the items in blue are raw data that are quickly obtained from a balance and the VelocityLab apps. The impulse time should be the same for both carts, so the white column shows the average impulse time which is used in computing the force, shown in the red columns. The green columns show the initial and final system (cart A and cart B combined) momenta. The yellow columns show the change in momenta for each of the carts. We note that for each of the four trials:
(1) The initial and final system momenta are reasonably close to being equal, as we would expect from the law of conservation of momentum.
(2) The change in the momenta for each of the carts are similar in magnitude but opposite in sign.
(3) The average force acting on each of the carts is also similar in magnitude but opposite in sign, as we would expect from Newton's Third Law of Motion.
As an example, the velocity vs. time graphs below show the details associated with trial 2 in the above table. From the graphs and the red markup shown on the graphs, it should be clear how initial and final velocities as well as impulse times were obtained for each of the two carts.
velocity vs time graph
As can be seen from the equations in the table showing the four trial results, the calculations are straight-forward but a bit tedious. Therefore a copy of the Excel spreadsheet is provided as an attachment. Your students can simply do scenarios of their own choosing and enter raw data into the blue columns. Excel will then do all the calculations for the remaining columns.
