
NGSS Alignment: MS-PS4-1
The disciplinary core idea behind this standard is PS4.A: Wave Properties. It specifically looks at how a simple wave has a repeating pattern with a specific wavelength, frequency, and amplitude. The Crosscutting Concept, Patterns, looks at how graphs and charts can be used to identify patterns in data. By creating graphs of mechanical waves, using a PocketLab Voyager or PocketLab One with a simple pendulum or a mass on a spring, students can examine how the graphs created are modeling by the movement and energy of the pendulum or mass-spring system. With the Science and Engineering Practice, Using Mathematics and Computational Thinking, students can then label the graphs with qualitative descriptions and quantitative data to describe a wave model.
MS-PS2-2: Use mathematical representations to describe a simple model for waves that includes how the amplitude of a wave is related to the energy in a wave.
The standard is broken down into the three NGSS pillars below:
Science and Engineering Practices - Using Mathematics and Computational Thinking
Disciplinary Core Ideas - PS4.A Wave Properties
Crosscutting Concepts - Patterns
Exploration
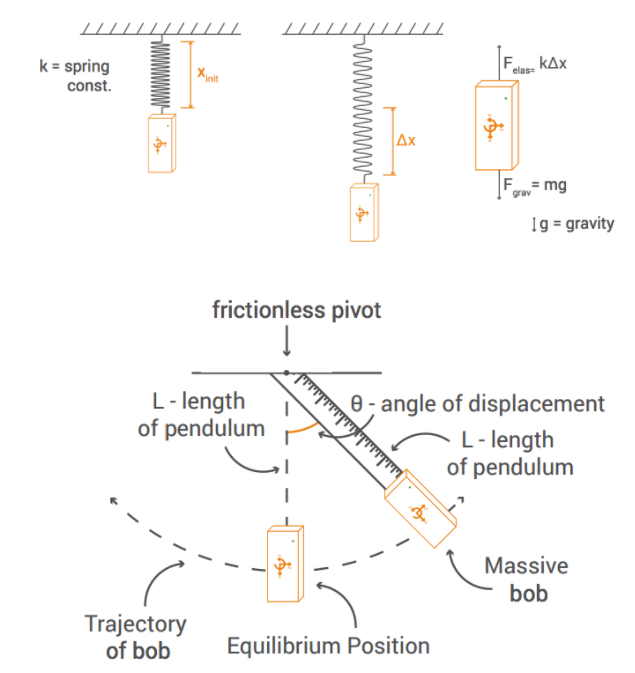
Simple Harmonic Motion is a periodic or oscillating motion where the forces of the movement cause a particular motion to continually repeat. The back and forth of a pendulum, like in an old grandfather clock, the ticking of a classic metronome, or the up and down movement a bungee jumper can all be examples of harmonic motion.
Using PocketLab you can investigate how to mathematically model harmonic motion through two classic examples, a swinging pendulum and a mass-spring system.
Objective:
In this experiment, students will:
1. Use PocketLab’s gyroscope and the scientific method to discover what variables affect the harmonic motion of a swinging pendulum.
2. Use PocketLab’s accelerometer and the scientific method to discover how mass affects the harmonic motion of a mass-spring system.
3. Determine and describe how harmonic motion can be mathematically modeled through wave graphs.
Download PDF for complete lab activity