
Investigating Pressure and Volume with a Syringe
Exploration
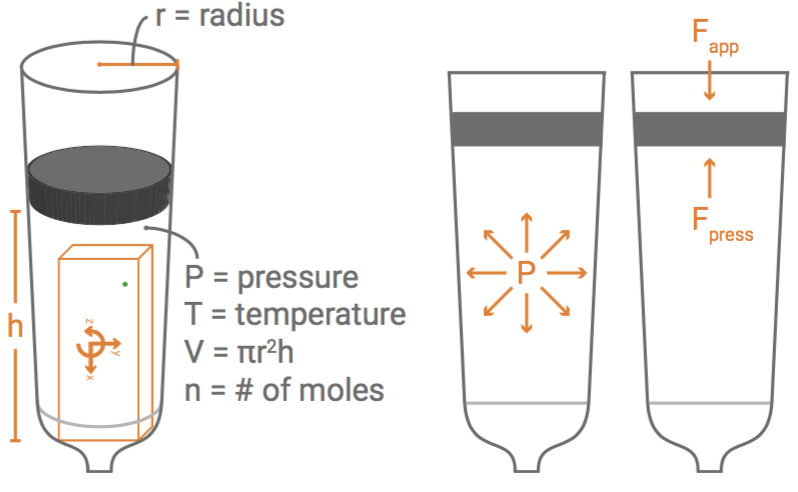
Explore air pressure and how it works. In a sealed syringe, as the plunger moves back and forth, the volume of air in the syringe changes. With a large enough syringe, a PocketLab can be placed inside to measure the change in pressure as the volume changes.
Materials
- Large syringe (needs to be large enough for PocketLab to fit inside).
- PocketLab One or PocketLab Voyager
Objective
In this experiment, students will be able to:
- Determine the relationship between air pressure and volume using a syringe.
- Explore what is happening to the air molecules when there is greater or less air pressure.
Extension Objective
Students will be able to
- Extend their exploration by using the relationships discovered to derive a portion of the Ideal Gas Law.
- Use the Ideal Gas Law to find total moles of gas in specific volume and pressure in the syringe.
Hypothesis and Predictions
- Before using the syringe, predict how you will be able to change the air pressure with it. Explain your reasoning.
- When the syringe is sealed, as the volume decreases, what will happen to the air pressure? Explain your reasoning.
Procedure
- Remove the plunger from the syringe and place the PocketLab inside.
- Turn the graph to Pressure and note the mBar reading when the plunger is removed.
- Place plunger back into the syringe. Take a few moments to play around with the syringe, moving the plunger back and forth while watching the pressure change. Place your finger on the opening of the syringe to seal it and move the plunger back and forth while watching the pressure change.
- Remove your finger from the opening of the syringe. Move the plunger to the syringe’s first volume increment (ex. 140 mL). Seal the opening of the syringe with your finger and record the pressure.
- Push the plunger to the next major increment on the syringe (ex. 130 mL) while keeping it sealed with your finger. Record the pressure.
- Continue pushing in the syringe to smaller and smaller volumes and recording the pressure. Be sure to always decrease the volume by the same amount (ex. 140 mL, 130 mL, 120 mL, 110 mL). Do so until you can no longer get the syringe all the way to the next increment.
Data Analysis and Observations
- Describe how you can use the syringe to change the pressure inside the syringe.
- As the volume of the syringe decreases, how is the pressure affected? Use the data collected to support your answer.
Conclusions
- What is air pressure a measurement of?
- Explain the relationship between the volume of the syringe when sealed and the air pressure inside the syringe. Describe why the pressure changes the way it does. Be sure to talk about the molecules in the air and what is happening to them.
- As you pushed the plunger farther into the syringe, why did it get more and more difficult? Why could you eventually not push it in any farther?
- Use the data collected to find the rate of change between the volume of your syringe and the air pressure inside the syringe. Write a linear equation that shows the relationship between volume and air pressure for your specific syringe.
- Pick an increment on your syringe that was too difficult to push the plunger to when the syringe was sealed. Use your equation to predict what the pressure would be if you could get the plunger to that point.
- If you were to push the plunger all the way into the syringe so it is just above the PocketLab, then seal the syringe with your finger and pull the plunger back out, what do you think would happen to the air pressure? Why? Try it.
- The atmospheric pressure is approximately 1,013 mBar at sea level and approximately 440 mBar at the top of Mount McKinley (also known as Mount Denali), the tallest mountain in the United States. Why do you think the air pressure changes at different elevations?
- An altimeter measures your altitude using air pressure.
- Describe how you think an altimeter works.
- What is the pressure at sea level? Use your syringe to get the pressure inside to be approximately the same as sea level and approximately the same as the top of Mount McKinley. Use the two-graph function along with “Pressure Altitude” to see how the pressure will pair with the altitude reading. Note: Sea Level should read 0 m of altitude and Mount McKinley should read 6,168 m.
- Look up the altitudes of other famous places and use the two-graph function, along with the syringe to find the air pressure at those different places. Record your findings.
Optional Extension
- Use the data to write the relationships between pressure, P, volume, V, and temperature, T. Note: To discover how temperature relates to the pressure and volume, seal the syringe with your finger and note the pressure. Without changing the volume or releasing your finger, find a way to increase the temperature of the air inside the syringe (hold it next to a heat lamp, candle, etc.). Observe the temperature graph and the pressure graph while it is heating. Note the relationship between temperature and pressure.
- After identifying the proportional and inversely proportional relationships between P, V, and T write an equation that relates all three variables. Note: This will not be the complete Ideal Gas Law. Only a portion of it.
- The other two variables in the Ideal Gas Law are the ideal/universal gas constant, R, and the amount of gas/ moles, N. Complete the equation with the following information: Pressure, P, is directly proportional to both R and N.
- Fix the syringe to a specific volume. Seal it with your finger. Determine the temperature, T, pressure, P, and volume, V. If the temperature is measured in Kelvins, the pressure is in Pascals, and volume in cubic meters, then R is 8.314 JK-1 mol-1 . Given those values, find the total gas/moles in the syringe.
Teacher’s Guide
Allow students some time to play around with the syringe and PocketLab to intuitively find the relationship between volume and pressure before they record much data. They should still make their predictions first, as the relationships in the lab will become immediately apparent. Make sure they try sealing the syringe with their finger and pushing the plunger in as far as they can. The students will not only observe the graph change in real time, but they will also feel the pressure increase as the plunger will get harder and harder to push into the syringe.
Make sure students are changing the volume by the same amount each time. It will be more difficult to find a linear relationship if the students aren’t changing the volume consistently (still possible, just more difficult). To find the linear equation (P=mV+b) between pressure, P, and volume, V, for the gas in the syringe, it may be easier for students to graph pressure versus volume and find the slope, m, and y-intercept, b, of the line to find the rate of change between the two variables and the starting point for pressure.
For the extension, students may need a background in chemistry, or at least an understanding of moles to fully understand the Ideal Gas Law. However, the mathematical relationships between the variables are still accessible with Pre-Algebra/Algebra 1 skills. Pressure, P, and volume, V, are inversely proportional. Temperature, T, and pressure, P, are directly proportional, meaning temperature, T, and volume, V, are also directly proportional. Pressure, P, and volume, V, are directly proportional to the ideal/universal gas constant, R, and the amount of gas/moles, N. The resulting equation is PV = NRT.