Newton's Law of Cooling
In this experiment students will use PocketLab Voyager to collect data related to the cooling of a container of hot water as time goes on. Sir Isaac Newton modeled this process under the assumption that the rate at which heat moves from one object to another is proportional to the difference in temperature between the two objects, i.e., the cooling rate = -k*TempDiff. In the case of this experiment, the two objects are water and air. Newton showed that TempDiff = To * exp(-kt), where TempDiff is the temperature difference at time t and To is the temperature difference at time zero. This equation expresses Newton's Law of Cooling.
In a similar earlier experiment by the author, PocketLab One was used to verify Newton's Law of Cooling. The lab setup was a bit more complex. This is because PocketLab One only has an internal temperature sensor. It was necessary to enclose PocketLab One in a small sandwich bag and make sure that the bag would not leak water and damage PocketLab One. In addition, the experiment took much more time as more water was required, increasing the lab time necessary for data collection.
The Lab Setup
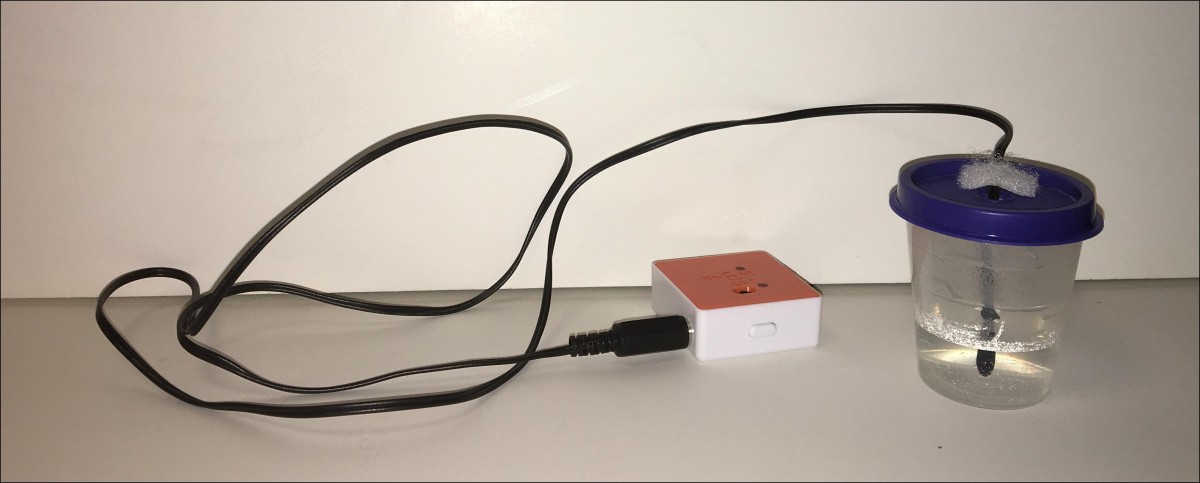
Figure 1 shows the author's setup for this cooling experiment. The thermistor of Voyager's temperature probe has been inserted into a small plastic container holding about 15 cc of water. The thermistor wire was Velcro'd to the top of the container to keep the thermistor stably located in the center of the plastic container. An empty pill bottle would work just as well. Of course, if you have ring stands, test tube clamps and test tubes, they could be used instead. The important thing is to keep the total volume of water small (around 15 cc). Doing so keeps the time required to collect sufficient data small enough that data collection can be done in about 30 minute. In addition, the negative exponential shape of the curve becomes noticeable.

Example Raw Data
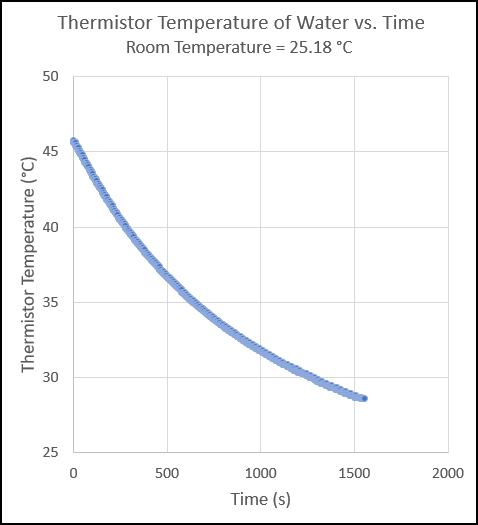
Figure 2 contains a typical graph of temperature of the water after about 25 minutes of data collection. Before Voyager data collection begins, it is necessary for the students to measure room temperature. The room serves as the heat sink for the cooling water. The data in Figure 2 was obtained when the room temperature was about 25 ⁰C. As can be seen in the graph, the temperature of the water is about 46 ⁰C at the start of data collection at time 0. The negative exponential nature of the cooling process is readily noted in the graph.

Data Analysis
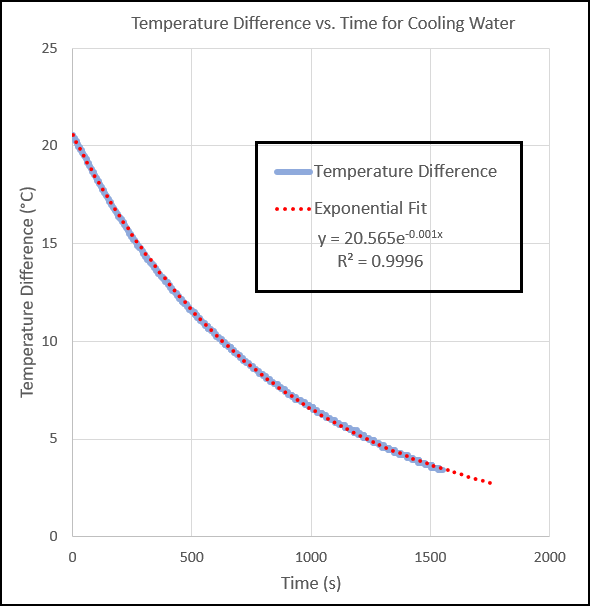
If you are using the trendline analysis capability of Excel to do a curve fit, you will need to add a column to your spreadsheet that contains the temperature difference. The temperature difference is the temperature probe's thermistor reading minus room temperature. See Figure 3. The result will be a nearly perfect fit (R-squared very close to 1) to Excel's exponential trendline feature. Note that the initial temperature difference shown in the graph (21 ⁰C) is equal to the initial temperature of the water (46 ⁰C) minus room temperature (25 ⁰C)
The reason that you need to set up the difference column in Excel is because Excel tries to fit the data to the model y = A*exp(-Cx). Excel does not use the model y = A*exp(-Cx) + B. If you want to make use of the latter model and not have to add a column for temperature difference, Vernier's Logger Pro® software would fit the bill well. The parameter B would be the room temperature. So if you forgot to measure the room temperature before starting the experiment, you could determine it from the value of B!

Conclusion
This lab clearly provides the student with a simple method to verify Newton's Law of Cooling. In the process of analysis, students have a chance to perform negative exponential curve fitting.

