
Lab Activity: Modeling Linear Motion with Position and Velocity vs. Time Graphs
Introduction:
This lab activity helps in understanding how measurements of an object's motion can be modeled in position and velocity vs. time graphs. Velocity is a vector measurement that gives an object’s speed and direction of movement. If a cart is pushed up a ramp, it will experience many changes in velocity that can be observed and measured. How does the velocity change as the cart is pushed, as it rolls up the ramp, as it changes directions at the top of the ramp, as it comes back down? Can these changes be modeled graphically? How do these changes relate to position and acceleration versus time graphs? These questions can be answered using PocketLab Voyager’s Rangefinder.
Objective:
In this experiment students will:
- Use PocketLab Voyager to collect data that tests hypotheses about the position of a cart as it travels on a ramp.
- Use PocketLab Voyager to collect data that tests hypotheses about the velocity of a cart as it travels on a ramp.
- Through data collection, investigate the relationship between position and velocity.
- Analyze data to draw conclusions explaining how position and velocity can be modeled graphically.
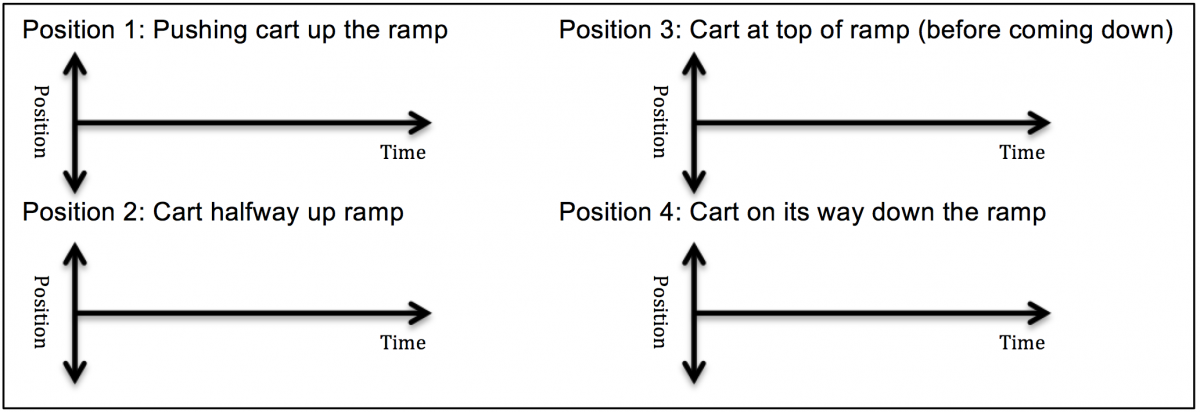
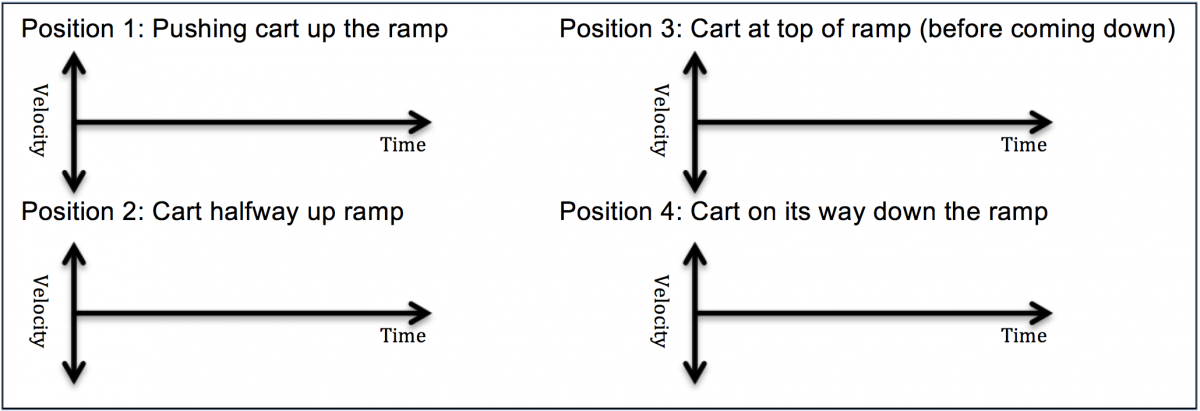
In today's lab activity, your hypothesis will be a series of sketches that predict what the position vs. time and velocity vs. time graphs will look like when the cart is at different positions on the ramp.
Hypothesis:
Part 1: Collect Data as a Group with PocketLab
In part 1 of the lab activity, your group will collect data using PocketLab Voyager and the PocketLab app (The screenshots were taken using the PocketLab web app. The PocketLab mobile app will look slightly different). Follow the steps below:
- Go to the PocketLab Web App (in a Chrome browser) using the following address: thepocketlab.com/app.
- Turn on the PocketLab Voyager by clicking the button on the top. It should begin flashing red and green.
- If using the PocketLab web app, click the text that reads, "Click here to connect". If using the PocketLab mobile app, the PocketLab Voyager should automatically connect.
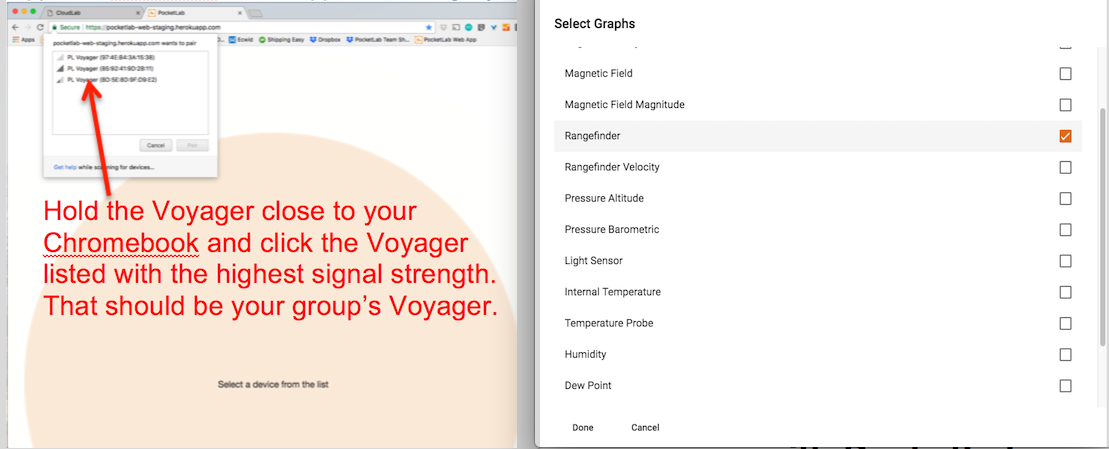
- Web app only: A pop-up box should appear showing all the PocketLab Voyagers that are turned on. Hold your PocketLab Voyager close to your computer/Chromebook. Click the PocketLab Voyager with the highest "signal strength."
- Click on the "Change Graph" icon. Click on "Range Finder", unclick "Acceleration", and click "Done".
You are now ready to collect data for your two runs and answer data analysis questions.
Data collection for Run 1: Position vs. Time
- Attach the PocketLab Voyager to the PocketLab HotRod (note: other carts can be used similarly) so the Voyager is facing forward with nothing obstructing the rangefinder window.
- Set up a ramp for the HotRod to roll up. The rangefinder works by sending out an infrared signal to determine its distance to other objects. At the top of the ramp, either have a wall, a large piece of cardboard, or poster paper so the rangefinder has a large surface that it can use to find its distance to the top of the ramp.
- Place the HotRod at the bottom of the ramp so the rangefinder window is pointing up the ramp at the wall, cardboard, poster paper, or whatever you have at the top of the ramp.
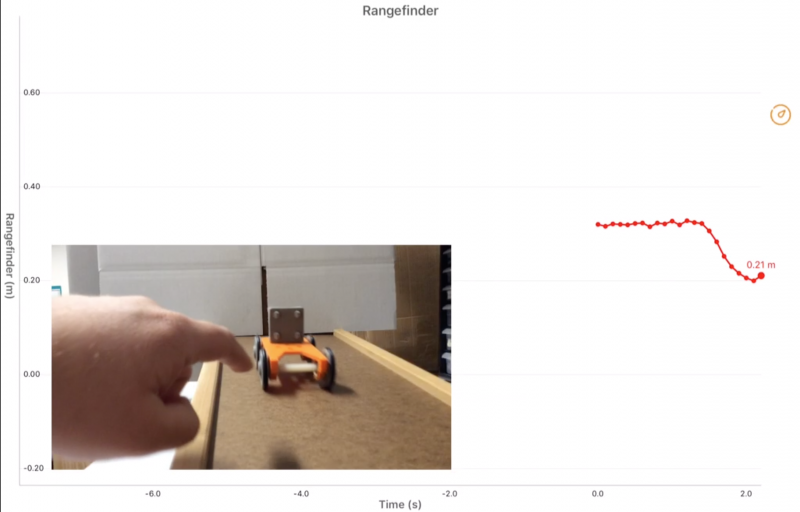
- The graph should be measuring the position of the HotRod from the top of the ramp. Make sure the data rate is measuring 10 samples per second.
- Hit the record button. Give the HotRod a quick push so it travels most of the way up the ramp, but doesn't hit the cardboard or wall at the top. (If it hits the cardboard or wall at the top, delete the recording and try again). Catch the cart at the bottom of the ramp.
- Hit the Stop button.
- Sketch the graph below. As you sketch the graph, discuss with your group how the graph you see on the screen represents how you observed the HotRod move on the ramp.
- Repeat steps to complete 3 more trials.
Data collection for Run 2: Velocity vs. Time
- Change the graph from "Rangefinder" to "Rangefinder Velocity".
- Repeat the steps for data collection in Run 1: Position vs. Time, except you'll be measuring Velocity vs. Time.
Data Analysis
Run 1 - Position vs. Time
- Pick one of your Position vs. Time graphs from Run 1. Draw it out in the box below. Make sure to draw it large enough so you can label different part of the graph.
- After drawing the graph, label every significant part of the graph. Where did the HotRod speed up, and slow down? What caused it to speed up or slow down? Where did it change directions? These are the types of questions that should be answered with your labeling. Provide plenty of details that explain how the graph modeled what you observed in the HotRod's movements.

Run 2 - Velocity vs. Time
- Pick one of your Velocity vs. Time graphs from Run 2. Draw it out in the box below. Make sure to draw it large enough so you can label different part of the graph.
- After drawing the graph, label every significant part of the graph. Where did the HotRod speed up, and slow down? What caused it to speed up or slow down? Where did it change directions? These are the types of questions that should be answered with your labeling. Provide plenty of details that explain how the graph modeled what you observed in the HotRod's movements.

Part 2: Drawing Conclusions and Writing a Lab Report
Option 1: Write a concluding paragraph that answers the Conclusion Questions at the bottom of the page.
Option 2: Write a full lab report for this lab activity. A lab report is a great way to summarize how you conducted your experiment and tested your hypothesis, the data collected, and any conclusions you can draw about the scientific question that was tested.
In your lab report include:
- Your original hypothesis from the beginning of the lab (in this case a description of your sketches of the position and velocity vs. time graphs).
- The objectives or scientific questions you wanted to answer with the lab activity.
- What materials you used in the experiment.
- A detailed description of how the lab was set up and how you tested your hypothesis.
- A summary of your data and the answers to your data analysis questions.
- Any observations you made with your group.
- A conclusion that answers the Conclusion Questions below.
Conclusion Questions
-How did the position and velocity vs. time graphs and data you collected match up with the sketches you did for your hypothesis? Would you say your hypothesis was valid or invalid? Why or why not? Support your answer with data collected from the lab experiment.
-Did gravity speed the cart up, slow the cart down, or both? Support your answer with data collected from the lab experiment.
-When collecting Position vs. Time data, when you pushed the cart up the ramp, why did position value get smaller? Think about how the PocketLab itself is measuring the data you are collecting to help you with this question.
-The Position vs. Time data approached zero (got smaller) as it went up the ramp, and got bigger as it went down the ramp. How did this affect the Velocity vs. Time data? Support your answer with data collected from the lab experiment.
-How did the Position vs. Time graph and the Velocity vs. Time graph model the change in direction of the HotRod at the top of the ramp?
-Did the HotRod ever stop moving during its journey on the ramp? Support your answer with data collected from the lab experiment.
-Velocity is a vector quantity that measures both the speed of an object and its direction. Explain how a graph can model both the speed of an object and its direction. Support your answer with data collected from the lab experiment.
Extra Extensions
-Acceleration measures change in velocity over time. Predict what you think an acceleration vs. time graph would look like for this activity. Explain your answer.
-You can measure the HotRod’s acceleration using either the acceleration graph from the PocketLab Voyager’s accelerometer or the acceleration graph from the VelocityLab app.
-Write a lab procedure that can test your hypothesis. Test your hypothesis and write a conclusion explaining whether it was valid or invalid. Support your answer with data/evidence collected in your new lab activity and scientific reasoning.