
Exploration
What is velocity? Velocity is often defined as speed with direction and speed is often defined as how fast or slow an object is traveling. But what exactly does being fast or slow mean? How can we represent an object’s velocity with an equation, graph, or other model? What is acceleration?
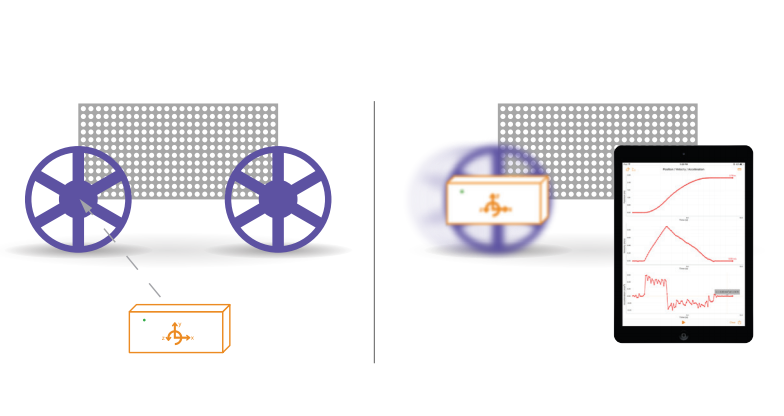
How can we represent an object’s acceleration with an equation, graph or other model? This experiment will use a cart with an attached PocketLab on the wheel. As the PocketLab rotates on the wheel, the VelocityLab app will measure the cart’s position, velocity, and acceleration versus time. Analyzing how these three graphs relate will help you better understand the linear motion of an object.
Objective
In this exploration students will:
1. Collect position, velocity, and acceleration data as a cart moves at a constant rate and at a changing rate.
2. Analyze the position, velocity, and acceleration versus time graphs.
3. Analyze how the position versus time graph is related to the velocity versus time graph and how the velocity versus time graph is related to the acceleration versus time graph.
4. Based on your analysis, define velocity and acceleration.
Download PDF for complete lab activity.