
With a pressure sensor built into PocketLab, there must surely be some way to investigate Boyle's Law. This law states that pressure and volume of an ideal gas are inversely proportional to one another provided that the temperature and amount of gas are kept constant within a closed system. What is needed is a closed system that is large enough to hold PocketLab in a way that pressure can be sensed while changing the volume of the enclosed gas (in our case, air).
Educational Innovations, Inc. (teachersource.com) currently sells a Microscale Vacuum Apparatus for $35.95 (as of 8/9/2016) into which PocketLab easily fits. The photo below shows this apparatus with PocketLab inside the polycarbonate bell jar.
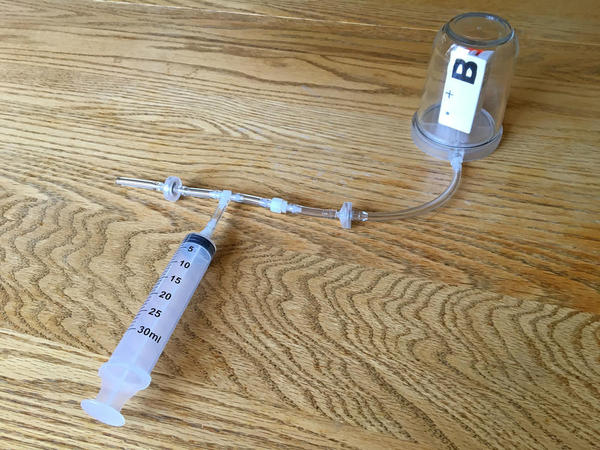
The student can determine the volume of the bell jar by a variety of methods. It turns out to be about 220 cc. An estimate of the volume of the air within the attached hose is about 2 cc. Estimating the volume of the solid parts of PocketLab that displace air in the bell jar to be about 12 cc, the volume of the trapped air is then approximately 210 cc when the syringe is at the zero mark.
Before collecting data with PocketLab's pressure sensor, the piston in the syringe is pumped enough times to bring the pressure down to approximately 300 mBar. Then the piston is pulled out and held at the 5 cc (or ml) mark for a few seconds. Then it is pulled further to the 10 cc mark and held for a few seconds. This process is continued by steps of 5 cc through the 30 cc mark. Meanwhile, PocketLab records the pressure of the trapped air, as shown in the video below. We therefore know the pressure readings and the corresponding volume readings (210 cc + 5 cc = 215 cc; 210 cc + 10 cc = 220 cc, etc., through 210 cc + 30 cc = 240 cc).
An Excel chart of the data is shown in the figure below. It clearly shows that increasing pressure results in decreasing volume--some kind of an inverse relationship. But what is the best trend/regression type fit for this data?
When linear, exponential, and power trend/regression types are applied in Excel, all there types provide R-squared value that are very close to one, ordinarily indicative of a good fit. See the three figure below for these charts.
As we can see in all three charts, our data is but a tiny portion of the spectrum of (volume, pressure) pairs possible. This is because of the large space required to hold PocketLab and its pressure sensor. The collected data would likely show more of a curve if this space was small compared to the volume of the syringe. Students can be encouraged to provide intuitive arguments against the linear and exponential trends (questions about what happens if the pressure is zero or the volume is zero--can any finite quantity of gas occupy zero volume?)
This leaves us with the power trend/regression as the only reasonable choice. The exponent is shown as -1.157, close to the value -1 that we would expect if volume and pressure were inversely proportional (i.e., if PV = constant).
