Introduction
Math students are typically introduced to the concept of slope in the 7th grade, learning that slope has to do with steepness. By the 8th grade many learn how to calculate the slope of a line as the rise divided by the run or rise over run. If the rise is positive, then the slope is positive (sloping upward). On the other hand, if the rise is negative, then the slope is negative (sloping downward). If the line is horizontal, then the slope is zero.
Physical science students often study slope from the point of view of its meaning in the analysis of position versus time graphs. They learn that the slope of a position versus time graph for an object moving along a straight line determines the velocity of the object. If the object is moving to the right, then the slope is positive and the velocity is positive. If the object is moving to the left, then the slope is negative, and the velocity is negative. They learn that speed tells how fast and object is moving, but velocity tells how fast and in what direction the object is moving.
The PocketLab Voyager/intelino smart train Slope Lab
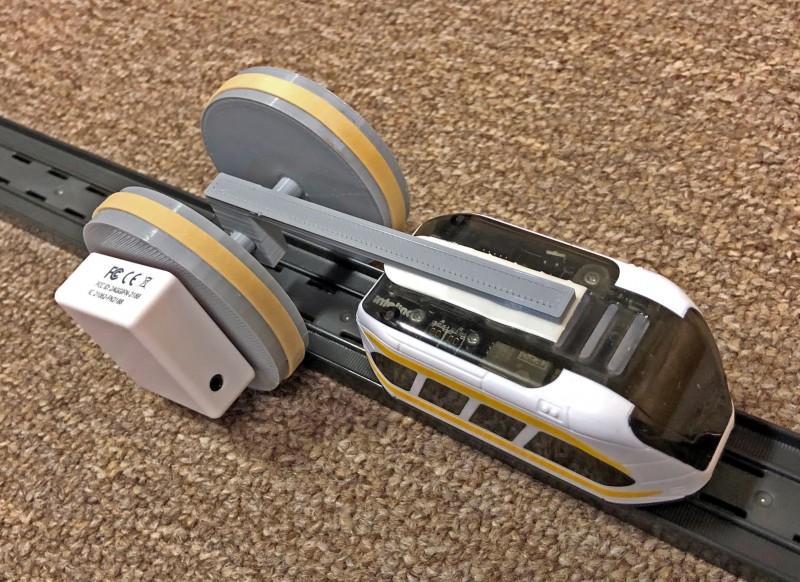
The "intelino® smart train" is designed for all ages, has an intuitive app, has built-in sensors to provide an interactive experience for the user, and is easily programmed with color snaps that allow the user to control intelino's actions. One of the things that can be controlled with color action snaps is the speed of the train, which can be varied between 30 and 70 cm/s. As shown in Figure 1, let PocketLab Voyager running on the VelocityLab app hitch a ride with the intelino engine, and you have the perfect combination for studying slope! VelocityLab will provide graphs of position, velocity and acceleration versus time, but the acceleration vs. time graph will not be used in this lab.
The measuring wheel consists of a pair of 3D printed wheels with rubber band tires, an axle, and a hitch. STL files are included with this lesson for the wheels, axle, and hitch. The hitch is attached to the intelino engine with a 3M damage free strip. Voyager is attached to the front wheel with a 3M damage free strip, with Voyager oriented as shown in Figure 1. The front of the intelino engine faces to the right. The weight of the measuring wheel plus Voyager is less than that of a pair of intelino wagons.
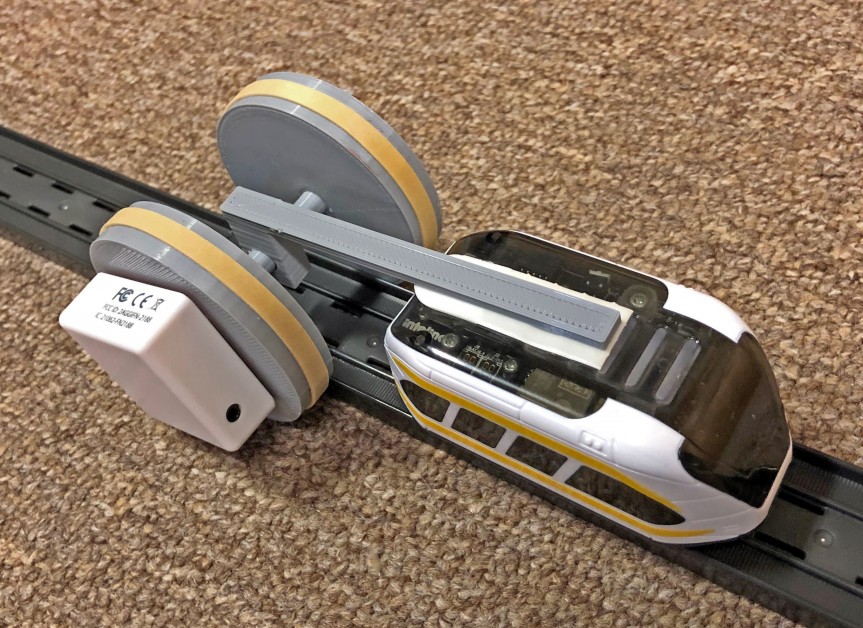
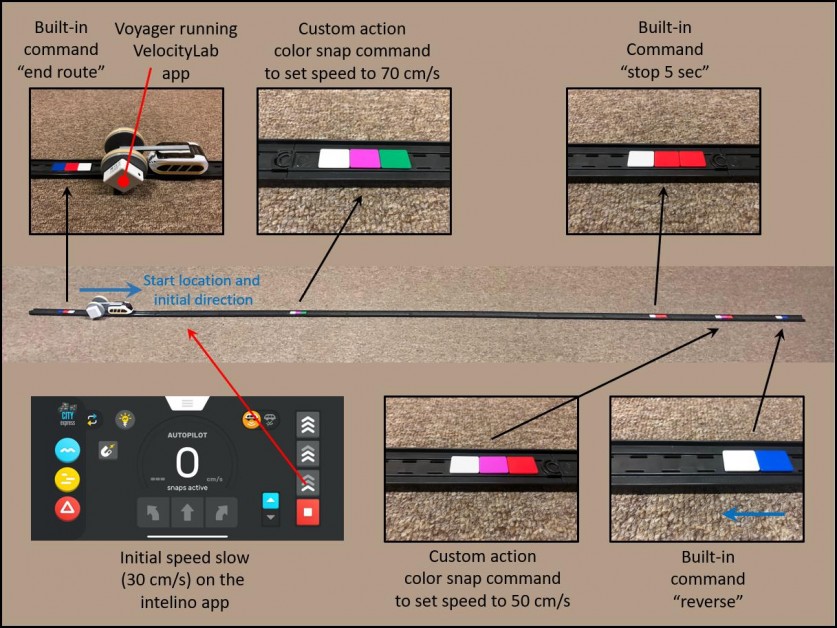
Figure 2 shows an example setup for the intelino/Voyager slope lab. This example has been designed to illustrate for the teacher a number of things that can be done with the intelino color snap commands. In the next section of this lesson, a progression of suggested activities are described that vary in complexity as students progress from grades 7 through 9.
The track layout of the example setup of Figure 2 consists of 12 straight tracks. The intelino engine/Voyager are started at the far left end of the track with an initial speed of "slow" (30 cm/s) using the intelino app in autopilot mode. When intelino/Voyager reach the custom color snap (white/magenta/green), the speed changes to 70 cm/s. Upon reaching the built-in command "stop 5 sec" (white/red/red), intelino/Voyager pause for 5 seconds. After the pause, the custom action color snap command (white/magenta/red) sets the speed to 50 cm/s. The built-in command "reverse" (white/blue) causes the engine to reverse its direction, after which it moves all the way back to the starting location at 50 cm/s. The built-in "end route" color snap command (white/red/blue) stops the engine. During the entire process Voyager collects position and velocity versus time data.
Video
The short 19-second video below shows a typical run of the intelino/Voyager slope lab.
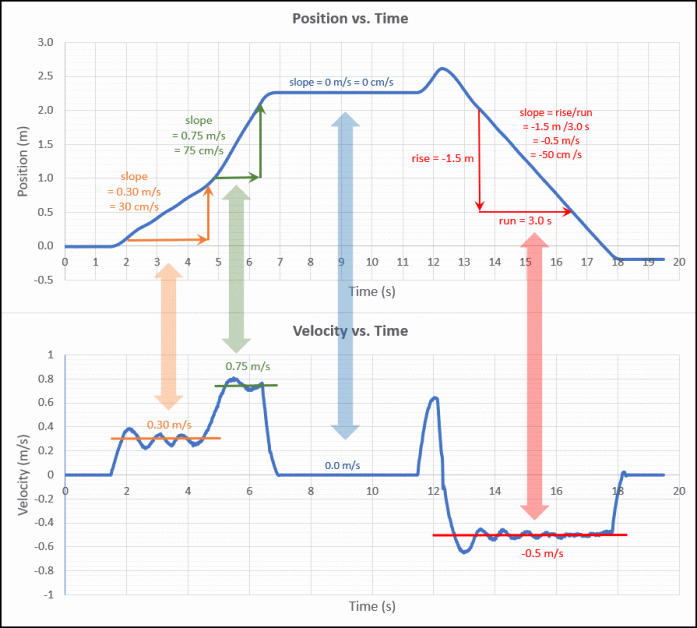
Figure 3 shows Excel charts of position and velocity versus time that have been constructed from data collected by the VelocityLab app. Note that the VelocityLab data collection rate should be set to 50 points/second. VelocityLab also requires input on the diameter of the wheel to which Voyager was attached. This value, after adding the rubber band tires to the 3D printed wheel, was 6.5 cm. The z-axis is specified as the "axis of rotation" in the VelocityLab app.
The relationship between the slope on the position versus time graph and corresponding velocity has been emphasized in Figure 3. With positive slopes on the position vs. time graph for the 0.30 m/s (orange) and 0.75 m/s (green) sections, the corresponding velocities on the velocity vs. time graph average around those values. Similarly, the blue region of 0 slope shows a velocity of 0 m/s. The red region has a negative rise, giving a velocity of -0.5 m/s, when the train moves backward to its starting position. The speeds set by the intelino color snap commands agree quite well with the speeds as determined by Voyager and the VelocityLab app.
Student Activity Progression
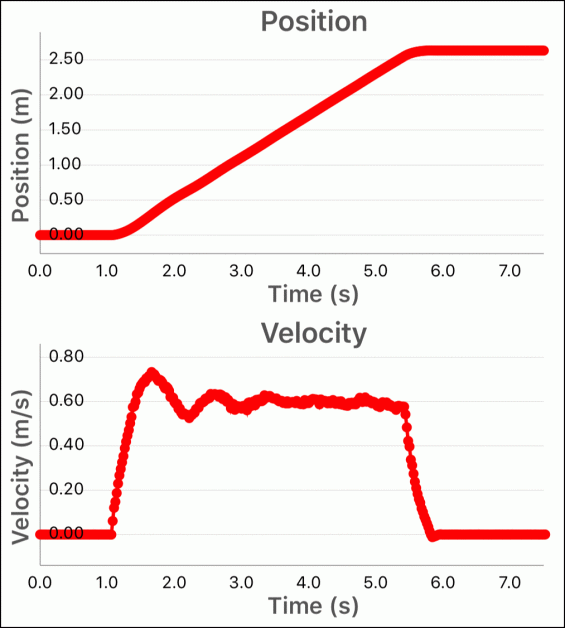
All of these activities make use of 12 straight tracks in sequence. For each of these activities, students should determine velocity by calculating the slope on the position vs. time graph. They should then compare their result to that given on the velocity vs. time graph as well as comparing their result to the intelino set speed. With the exception of Activity #7 which runs at a data collection rate of 50 points/second, the data rate can be set to 10 points/second for the remaining activities.
Activity #1: Constant Speed
Intelino/Voyager are started at the left end of the track at the intelino "fast" speed (60 cm/s) in autopilot mode. The only color snap command is near the right end of the track. It is an "end route command" (white/red/blue). Figure 4 shows the corresponding position and velocity vs. time graphs from the VelocityLab app.
Activity #2: Constant Speed with a 2-second Stop Mid-Route
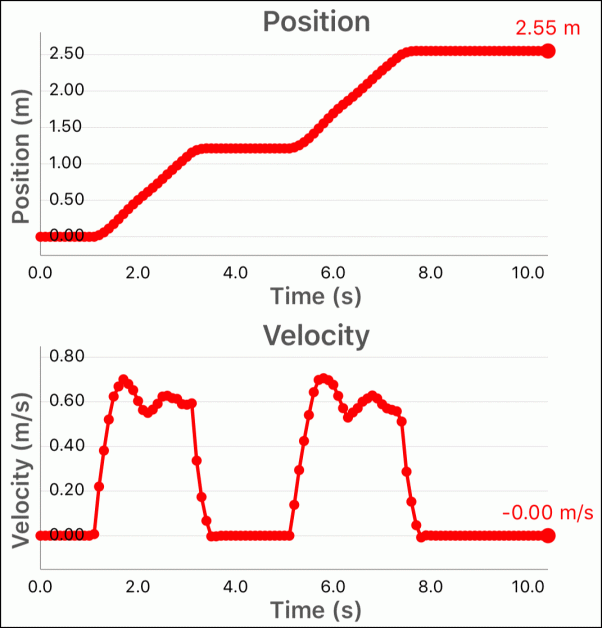
Intelino/Voyager are started at the left end of the track at the intelino "fast" speed (60 cm/s) in autopilot mode. There is a "stop 2-sec" color snap (white/red) command at the middle of the track and an "end route command" (white/red/blue) near the far right end of the track. Figure 5 shows the corresponding position and velocity vs. time graphs from the VelocityLab app.
Activity #3: Constant Speed Forward and Backward
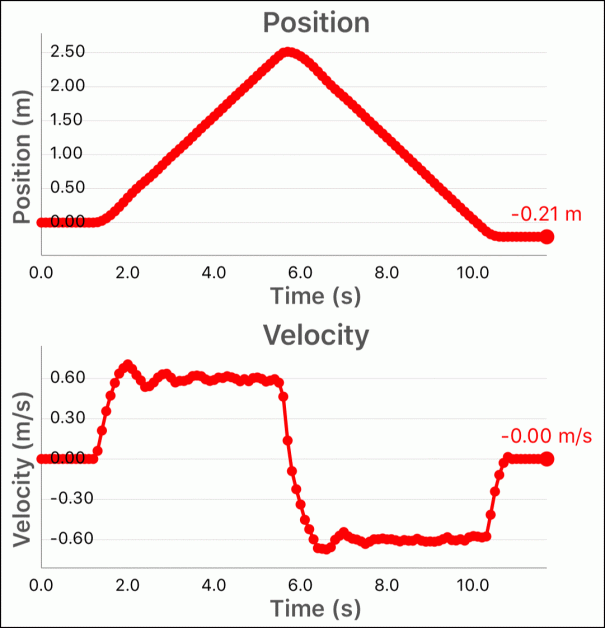
Intelino/Voyager are started at the left end of the track at the intelino "fast" speed (60 cm/s) in autopilot mode. There are two color snap commands:
- An "end route" command (blue/red/white) near the left end of the track.
- A reverse command (white/blue) at the far right end of the track.
Figure 6 shows the corresponding position and velocity vs. time graphs from the VelocityLab app.
Activity #4: Constant Speed with 2-second Mid-Route Stops Both Forward and Backward
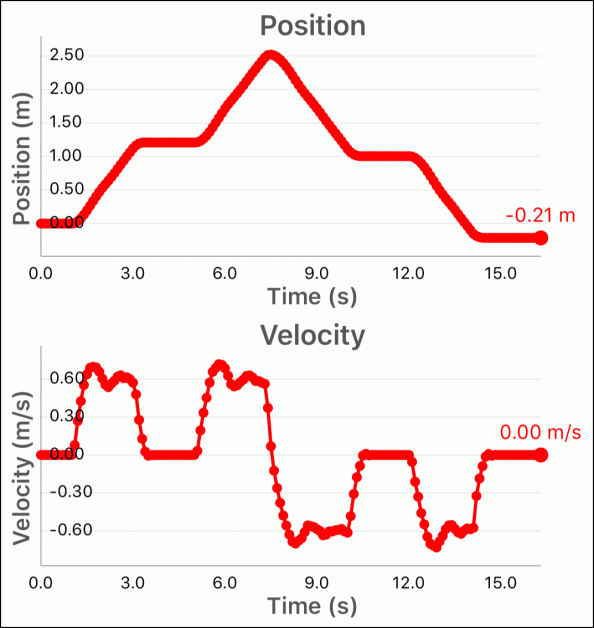
Intelino/Voyager are started at the left end of the track at the intelino "fast" speed (60 cm/s) in autopilot mode. There are three color snap commands:
- An "end route" command (blue/red/white) near the left end of the track.
- A reverse command (white /blue) at the far right end of the track.
- A "stop 2-sec (both directions)" command (white/red/white) at the middle of the track.
Figure 7 shows the corresponding position and velocity vs. time graphs from the VelocityLab app.
Activity #5: Mid-Route Speed Change
Intelino/Voyager are started at the left end of the track at the intelino "fast" speed (60 cm/s) in autopilot mode. At mid-route the speed is manually changed to "slow" (30 cm/s) with the autopilot mode of the intelino app. The only color snap command is an "end route" command (white/red/blue) at the far right end of the track. Figure 8 shows the corresponding position and velocity vs. time graphs from the VelocityLab app.
Activity 6: Setting Speeds with Custom Color Action Snaps
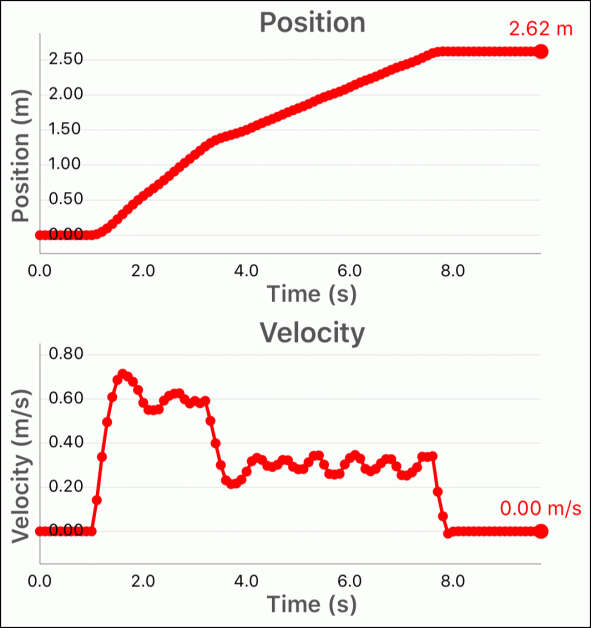
In this activity the forward speed (left to right) will be set to 40 cm/s while the return backward speed (right to left) will be set to 65 cm/s. Four color action snaps will be used:
- An "end route" command (blue/red/white) near the left end of the track.
- A reverse command (white/blue) at the far right end of the track.
- A little to the right of the end route command you will need to set color action snaps (for example, white/magenta/red) to a speed of 40 cm/s.
- A little to the left of the reverse command you will need to set color action snaps (for example, (white/magenta/blue) to a speed of 65 cm/s.
Figure 9 shows the corresponding position and velocity vs. time graphs from the VelocityLab app.
Activity #7: Performing the Setup Shown in Figure 2
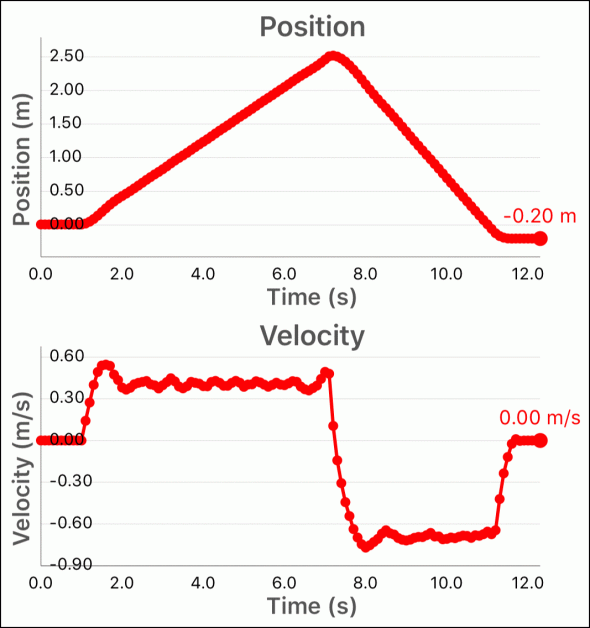
This final activity combines everything that you learned from the first six activities into a single run. Figure 2 shows the setup and Figure 3 shows the position and velocity versus time graphs.
Additional intelino/PocketLab Voyager Lessons
PocketLab Voyager Rides the “intelino® smart train” (a lab studying speed, elementary and middle school)
intelino smart train/Voyager: Angular Velocity (elementary and middle school)
intelino smart train/PocketLab: Match-made-in-heaven (a lab studying speed, elementary and middle school)
intelino/PocketLab: Relative Velocity Lab Grades 6-9 (middle school)
intelino/PocketLab: A Study of Randomness for Grades 6-8 (math students)
intelino/PocketLab: Impulse & Change in Momentum (AP physics)
intelino/PocketLab: Velocity vs. Impulse to Stop (high school and AP physics)
intelino/Voyager Lab: Stopping Distance vs. Speed (middle school and high school)
Pi from Voyager and an Intelino Smart Train (4th grade through middle school math)
