What is hysteresis?
Hysteresis can be defined as a lag time in the response of a system to forces placed on the system. A common way used in physics classes to observe hysteresis is by loading and then unloading weights from a suspended rubber band, while observing the extension of the rubber band. Students find that the rubber band does not Obey Hooke's law. They also observe that the amount of stretch of the rubber band is different when unloading than when loading.
Similar effects can be observed when loading and unloading the PocketLab Voyager's tactile sensor. This lesson contains two activities that allow students to learn about hysteresis associated with tactile sensors.
Activity #1
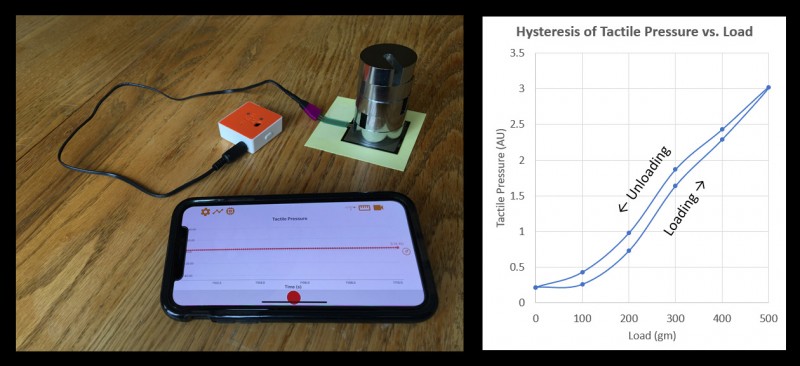
In this activity, we will investigate how the tactile sensor's output under a constant load changes with time. Figure 1 shows the experiment setup that was used by the author of this lesson. A pile of three Post-It notes are stuck to the tabletop. The tactile sensor is then taped to the Post-It notes with a piece of tape on the arm of the tactile sensor. Doing this keeps the sensor more stable so that it will not move around. Data collection at the default rate of 10 points/second is started. Then 500 gm of weight were placed on the sensor. Data was collected by the PocketLab app for a period of about 15 minutes. The data was then exported to Excel for analysis.
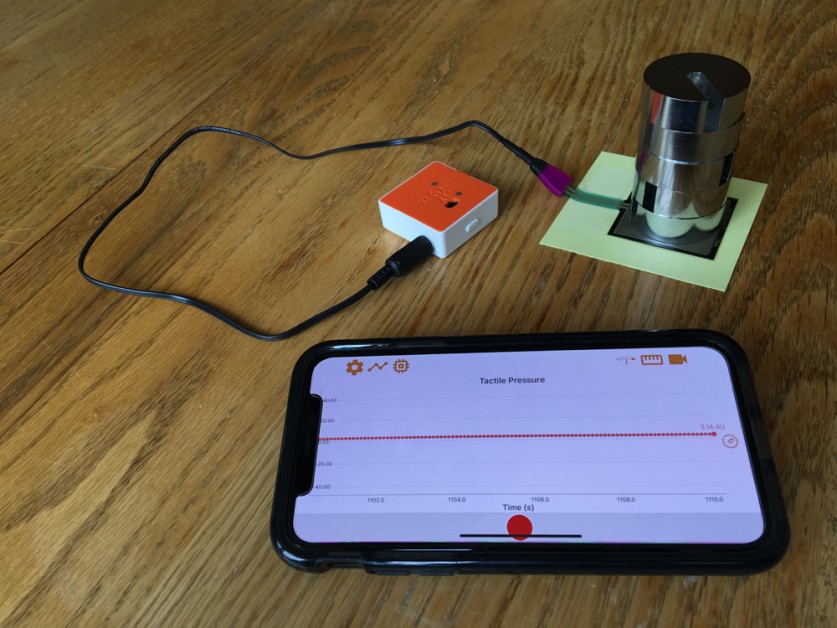
Figure 2 shows a graph of Tactile Pressure vs. Time. Initially, the output from the tactile sensor increases fairly rapidly, with the rate of increase decreasing over time. The blue line showing tactile pressure on the graph appears to be logarithmic in shape. Therefore, a logarithmic trendline (shown as red dots) of the data was plotted in Excel. The equation of best fit shows an R-squared value of 0.9875. It appears that tactile pressure vs. time is logarithmic. The time lag between applying the weight to the tactile sensor and a stable output can be quite large.
Activity #2
In this activity, the tactile sensor will be gradually loaded with 100, 200, 300, 400, and 500 gm masses, adding a 100-gm mass approximately every 10 seconds. Then the masses are removed one by one, every 10 seconds. Meanwhile, the PocketLab app will be recording the tactile sensor readings at the default rate of 10 points/second. Figure 3 shows a portion of this raw data as it appears on the PocketLab app graph.
Figure 4 shows a graph of the entire data set after exporting the PocketLab app data into Excel. Each segment is labeled with the load in grams and the corresponding tactile sensor reading in AU. We note that for each of the 10-second segments, the tactile pressure readings are gradually rising, which we expect from our observations in activity #1. The tactile pressure values shown for each of the segments is the value near the middle of the segment. We also note that the values while unloading are higher that the corresponding values when loading the masses.
We are now ready to prepare our final graph, showing hysteresis in a manner that is quite common. Figure 5 is a scattergram of the data pairs from each of the segments in Figure 4. The loading and unloading portions of the graph have been labeled for clarification. For any given load, the tactile pressure while unloading is higher than the tactile pressure when loading.
Conclusions
When considering applications that make use of the tactile sensor, it is important to keep the effects of hysteresis in mind. For the PocketLab tactile sensor, we have found that hysteresis will increase tactile readings over time. For readings that are quite far apart in time, this increase can be large. Figure 5 also shows that the tactile readings are not linear with load. It seems that relative changes can be observed, but exactly quantitative readings are not possible unless a calibration is done.
Additional considerations relate to the nature of the surface upon which the tactile sensor is resting. Our experiment use a pad of a pile of three Post-It notes. Would the results be different if we had the sensor directly on the oak wood tabletop? What if the sensor was resting on a piece of cloth, such as a soft wash rag?
Additional Voyager Tactile Pressure Sensor Activities
Links to three additional tactile pressure sensor investigations are: