Introduction
In a PockeLab lesson entitled "Hydrostatic Pressure Lab", posted by kwarnke in October 2017, students investigate the relationship between the height of a column of water and hydrostatic pressure. The lab results worked very well in this regard, but the apparatus uses a 5-gallon jug with modifications, a bicycle pump, and 5 meters of vinyl tubing. We should be able to come up with a much simpler and less expensive fluid pressure apparatus to achieve the same result, as the PocketLab pressure sensors all have a resolution of 1.3 Pa over a range from 30 to 180 kPa (1 atmosphere = 100 kPa). There is really no need in a student lab experiment to provide pressures approaching the 180 kPa limit of PocketLab.
Our Fluid Pressure Lab Setup
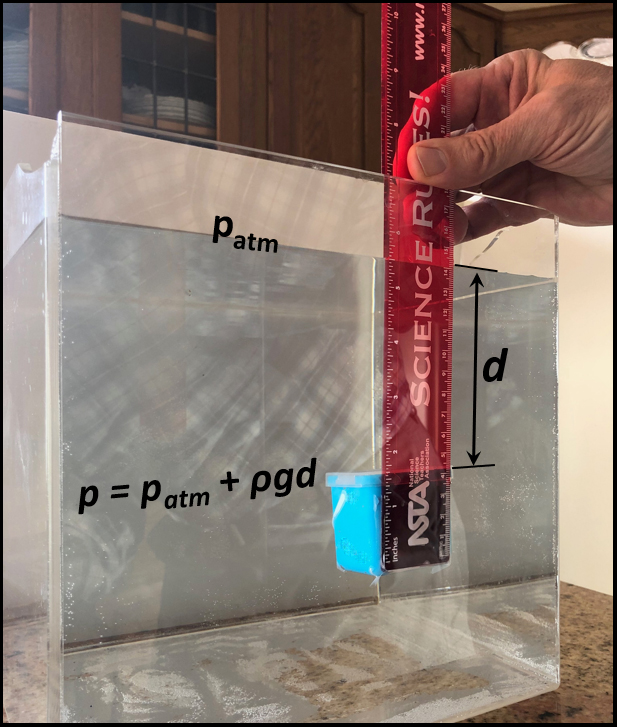
Figure 1 shows the setup for our fluid pressure lab. Any fairly large plastic container, such as a plastic bucket, should work well for holding the water. The author used a clear acrylic container so that everything would be easy to see. A small plastic container just large enough to hold PocketLab is attached to a ruler using Scotch Storage Packaging Tape. The ruler can then be lowered into the water, while PocketLab records the pressure with its barometric pressure sensor.
The Bluetooth Low Energy signal (BLE) that PocketLab uses to transfer data to your data collection device attenuates fairly rapidly in water. At a depth of about 20 cm, the author found that the BLE signal could no longer be recognized by the data collection device. Therefore, is is advisable to keep the container with PocketLab near the edge of the plastic bucket and have your data collection device near that edge outside the bucket. Alternatively, you can put PocketLab in memory data logging mode. In this case, the data will be kept in PocketLab's internal memory with no need to broadcast it via Bluetooth during data collection! If you do this you could probably lower PocketLab to the bottom of a bathtub full of water or a swimming pool. This would allow you to investigate a wider range of depths, but as pointed out in the Introduction, there is no need to do this.
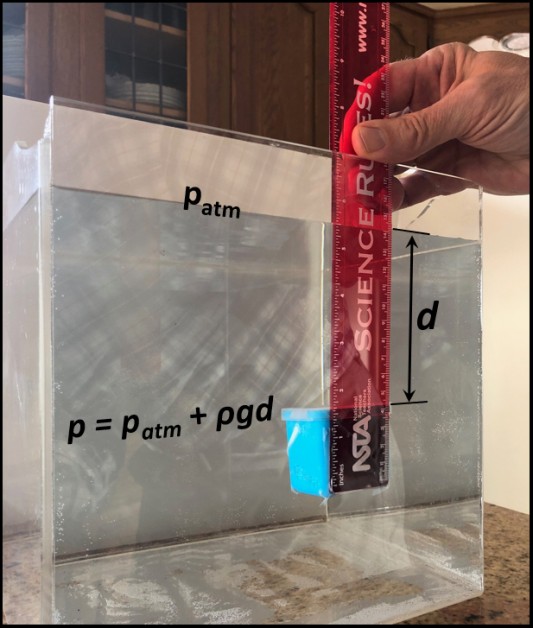
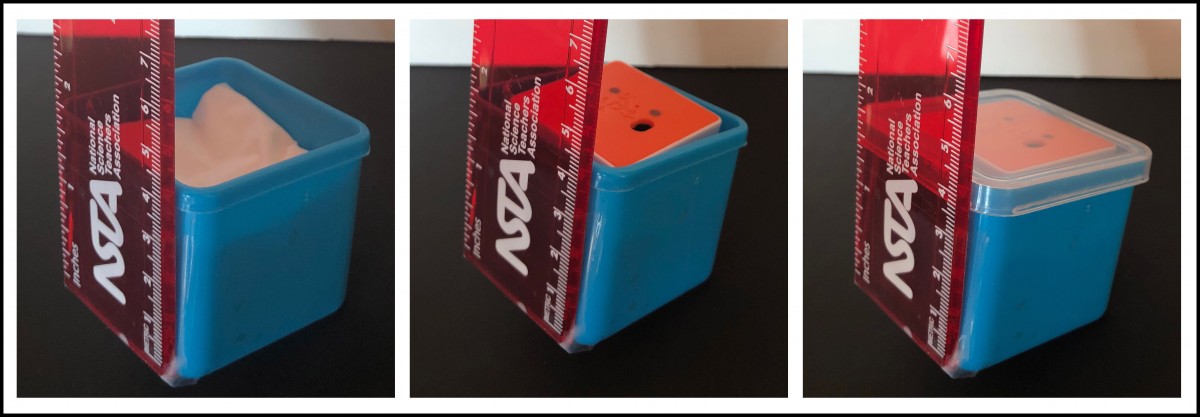
Figure 2 shows the PocketLab container used by the author. The ruler has been attached. The left-most picture shows that some facial tissues have been folded to line the bottom of the container. The purpose of these tissues is to protect PocketLab by absorbing any water that may leek into the container. Never-the-less, the container should be tested without PocketLab by keeping it deep in the water for a few minutes, to make sure that leakage is minimal. The middle picture shows that PocketLab has been added to the container. The right-most picture shows the container with its cover affixed.
Static Fluid Pressure Physics Theory
Figure 1 shows an equation for the pressure at a depth d from the top surface of the water that is open to the atmosphere. This equation can be derived using calculus by considering the forces acting on a small volume element of water at rest. We see that this pressure consists of two components: atmospheric pressure at the surface plus pressure due to the fluid at depth d, ρgd. ρ is the density (mass per unit volume) of the fluid. Since liquids are almost incompressible, ρ can be taken as a constant. For water at a wide range of temperatures and atmospheric pressure, ρ is approximately 1000 kg per cubic meter (1 g per cubic centimeter). With the acceleration of gravity g being essentially constant over the range of our experimental apparatus and ρ also being constant, it can be concluded that theory predicts that the pressure p should be proportional to the depth d. This is precisely what students should discover when performing this lab.
Experimental Results
The author found that the easiest way to perform this experiment is to start at a depth of zero and record pressure readings for approximately 10 second intervals for depths increasing by 0.02 m (2 cm) after each interval. The container with Pocket Lab should be kept in the water for a couple of minutes before collecting data to allow for temperature equalization between PocketLab and the water. The author also didn't begin data collection until the water had reached room temperature, i.e., the water was drawn and sat at room temperature overnight before performing the experiment. The Excel chart of Figure 3 shows pressure vs. time for a typical data collection trial of pressure data using PocketLab. The water depths for each of the"steps" have been noted in red. The corresponding pressure can be read from a typical point on each step. If you want to get fancier, you can compute the average pressure in the horizontal portion of each step using Excel. Alternatively, if you collected your data in a PocketLab CloudLab trial, you can use the data analysis feature of CloudLab to quickly find the average for each of the regions.
Figure 4 shows our final graph of Pressure vs. Depth of Water. A linear fit was performed on the data experimental data using Excel. An r-squared value of 0.9988 shows excellent agreement to a linear fit. In the equation y = 9.9833x + 98.506, x is water depth in meters, and y is pressure in kPa. The y-intercept is the atmospheric pressure at the surface (very close to 100 kPa as we would expect). The coefficient of x is the slope of the straight line of best fit. This slope corresponds to the rise in pressure expected for each meter increase in water depth, approximately 10 kPa per meter.
Conclusion
We have seen that your students or student groups can conduct a simple and quick experiment verifying that fluid pressure is proportional to depth in a liquid that is at rest.
Here is a quick video of a typical PocketLab trial that shows the variation of fluid pressure with water depth.