Introduction to Calibration
Sensor-based inquiry is a dominant force in today’s science education, with the calibration of sensors being essential for high-quality measurement. Wikipedia® defines calibration as “the comparison of measurement values delivered by a device under test with those of a calibration standard of known accuracy.” In this lesson students will study the process of calibration in an experiment to determine the speed of the intelino engine as the accelerator is incremented in ten equally spaced steps from zero to full throttle.
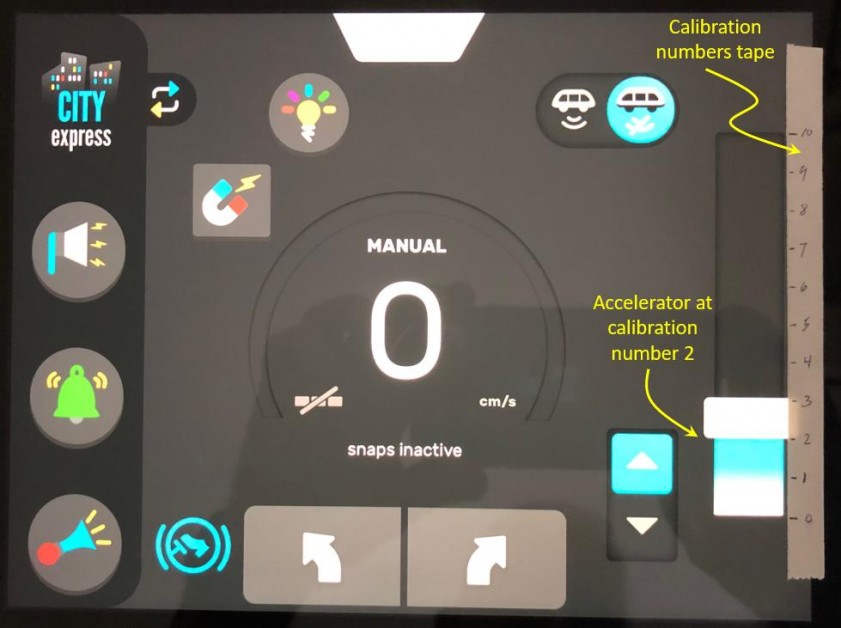
Figure 1 shows the intelino app with a paper tape along the accelerator. Equally spaced calibration marks on the tape are numbered from 0 through 10. These will be the measured values delivered by the device (the intelino engine) under test. With Voyager attached to the top of the intelino engine, data from the PocketLab app will be used to determine actual speed of the engine--the standard of known accuracy. The student's task is to correlate calibration numbers on the tape to actual intelino speeds and graph speed versus calibration numbers.
Suggested Experiment Setup
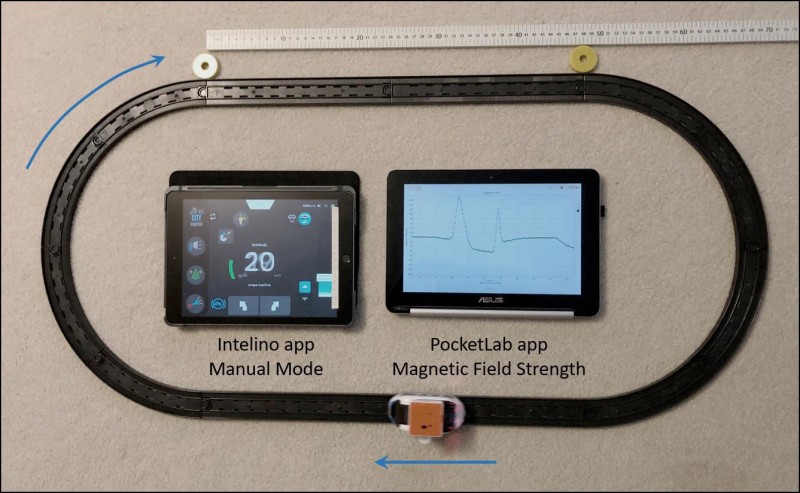
Figure 2 shows the track layout and experiment setup used by the author of this lesson. The layout shown was designed so that it would make use of track that comes with the intelino starter set. No extra track is needed. The intelino app is set to "Manual" mode so that the accelerator appears on the right side of the screen. A narrow strip of paper tape with equally spaced marks from 0 through 10 is placed alongside the accelerator, with 0 at the bottom and 10 at full throttle. PocketLab Voyager has been mounted to the top of the intelino engine with a 3M damage-free strip. The engine moves in the direction shown by the blue arrows. A pair of magnets acting as gates spaced two straight tracks apart (about 48 cm) record peaks in magnetic field strength as the engine moves past them. Students can then determine the speed of the engine by dividing this distance by the time interval between the two magnetic field peaks. The data collection rate for the PocketLab app is set to the maximum of 50 points/second.

Experiment Procedure
Figure 3 shows a typical run of magnetic field versus time. Data was collected with the intelino engine fully charged. Obviously, when the accelerator is at calibration number 0 the speed is 0. The engine's motion was quite erratic at calibration number 1, so is not included in the data. The first data collected was with the accelerator at calibration number 2. With each lap around the track, the accelerator is moved up one calibration number before the engine reaches the first of the two magnets. As indicated earlier, students can then determine the speed of the engine by dividing this distance by the time interval between the two magnetic field peaks. Students can read the time for each peak directly on the PocketLab app screen, as shown at the far left of Figure 3. To help students preforming this experiment, a pdf of a data collection table accompanies this lesson.
Data Analysis
Figure 4 shows the calibration graph obtained by the author of this lesson, with the straight line of best fit going through the origin (where the speed is clearly zero). Students can "eye" there straight line of best fit through their data points. The linear relationship between speed and calibration number shows that it is a reasonable approximation to assume that the speed in cm/s is about ten times the calibration number. For example, a calibration number of 4 gives a speed of 40 cm/s, a calibration number of 6 gives a speed of 60 c/s, and so on. The pdf file accompanying this lesson contains and "empty" graph on which students can plot their data points.
Additional intelino/PocketLab Voyager Lessons
For a quick listing of all Voyager/intelino lessons click here.
PocketLab Voyager Rides the “intelino® smart train” (a lab studying speed, elementary and middle school)
intelino smart train/Voyager: Angular Velocity (elementary and middle school)
intelino smart train/PocketLab: Match-made-in-heaven (a lab studying speed, elementary and middle school)
intelino/PocketLab: Relative Velocity Lab Grades 6-9 (middle school)
intelino/PocketLab: A Study of Randomness for Grades 6-8 (math students)
intelino/PocketLab: Impulse & Change in Momentum (AP physics)
intelino/PocketLab: Velocity vs. Impulse to Stop (high school and AP physics)
intelino/Voyager Lab: Stopping Distance vs. Speed (middle school and high school)
Pi from Voyager and an Intelino Smart Train (4th grade through middle school math)
intelino/Voyager: 7-9 Math/Physical Science Slope Lab
intelino/Voyager: Periodic Motion Lab (middle school and high school)
Intelino / Voyager Lab: "Floor-it" Acceleration/Max Speed (middle school and high school)
Intelino / Voyager: Angular Velocity vs. Speed in Circular Motion (4th grade through middle school)