PocketLab Voyager Total Lunar Eclipse Light Intensity Data
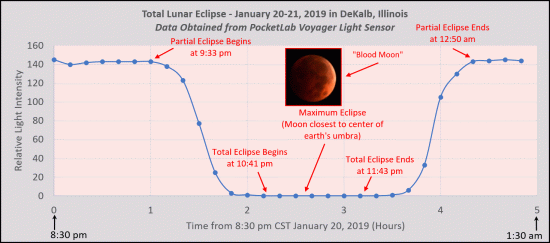
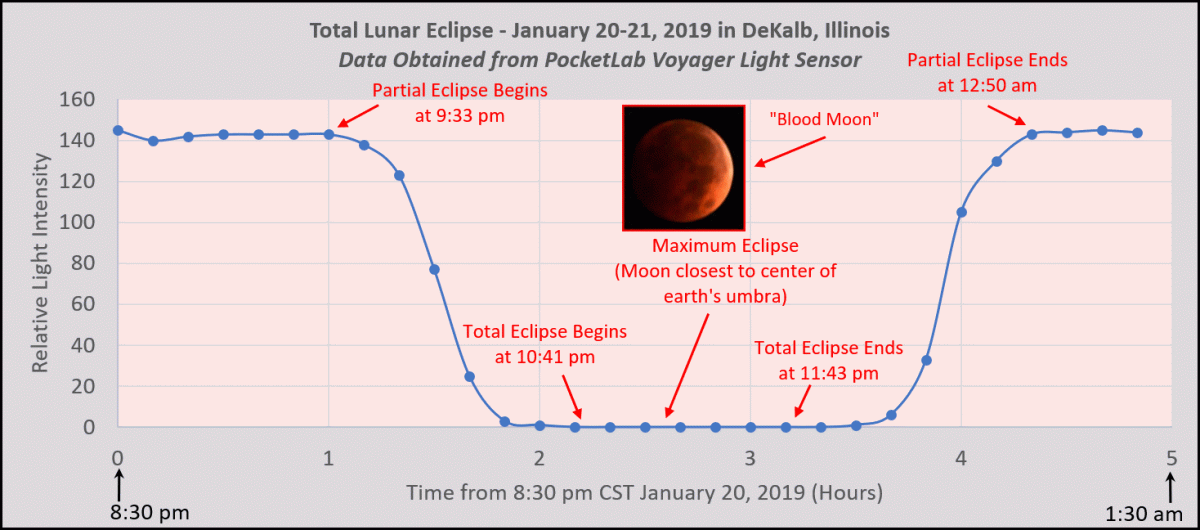
I was fortunate enough to have a perfectly clear sky in DeKalb, Illinois to capture light intensity data for the January 20-21, 2019 total lunar eclipse. This opportunity to collect light intensity data of the eclipse using PocketLab Voyager was a must do! See Figure 1.
Procedures
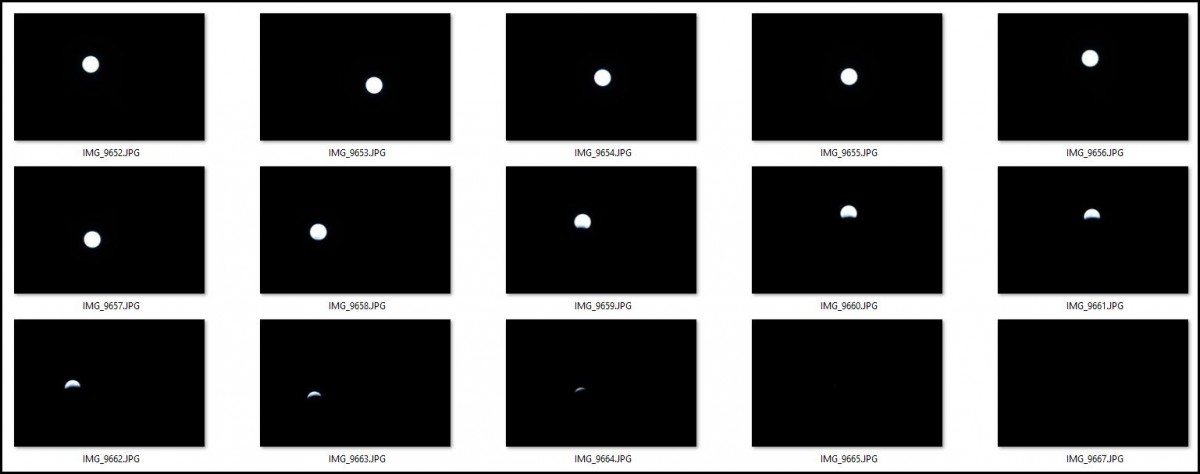
Since the Voyager light sensor is not capable of capturing the low light levels from the moon, we need to come up with an alternative approach. Photos of the moon were taken every 10 minutes from 8:30 pm until 1:20 am. The photos were taken with a Canon EOS 5D with a Canon EF 300mm telephoto lens with an image stabilizer. All pictures were taken using manual settings with aperture F4.0, shutter speed 1/100s, and ISO 160. This insured that light intensity from the moon was not adjusted by the camera from one image to the next. Figure 2 shows the first 15 of these images.
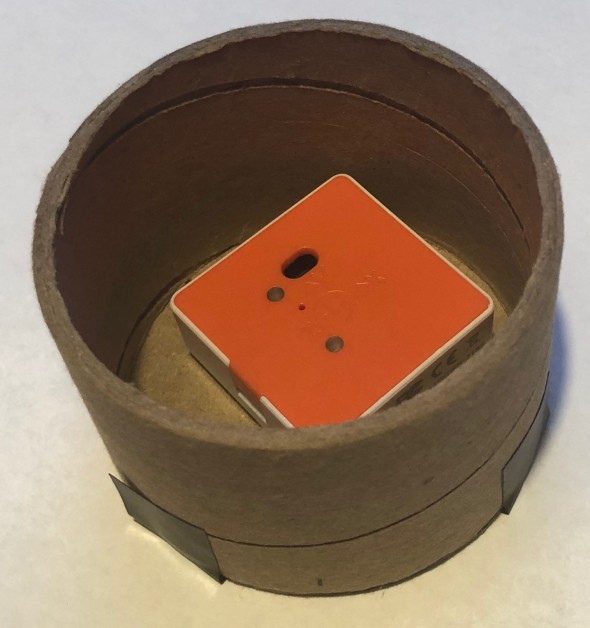
PocketLab Voyager was mounted to the inside of a cardboard cylinder with its light sensor near the center of the cylinder, as shown in Figure 3.
Each image was then inserted into PowerPoint and displayed so that the lunar image was the same diameter as the cardboard cylinder. See Figure 4.
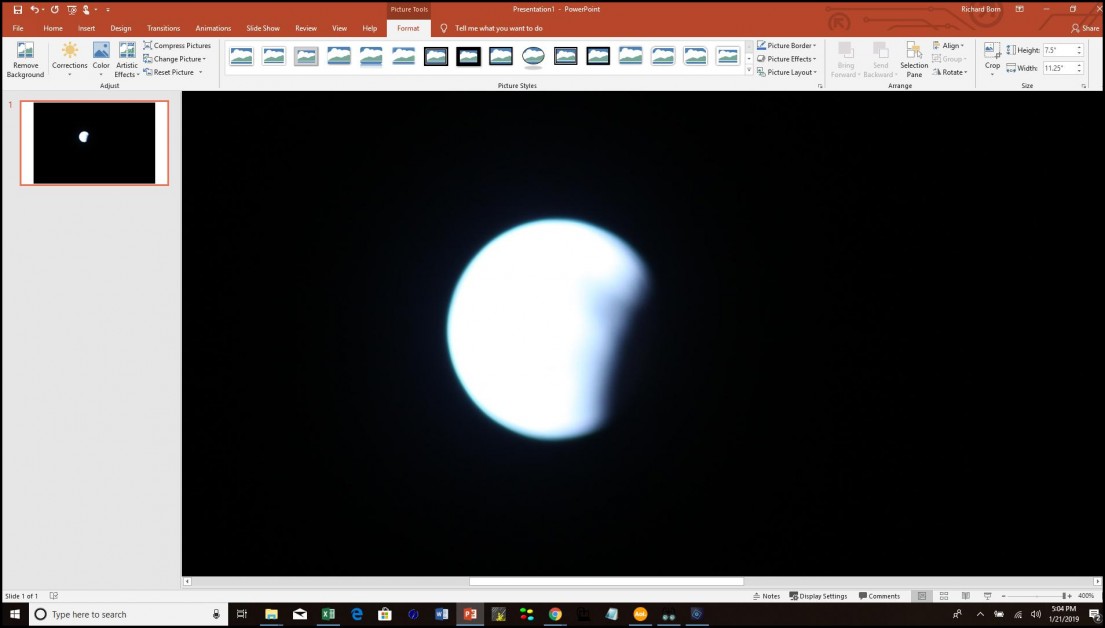
Finally, the cardboard tube was placed over and covered the image, as shown in Figure 5. The light intensity reading from Voyager's light sensor was recorded and entered into an Excel spreadsheet from which the final chart was constructed.
Addendum
The idea of taking photos and analyzing the light in them with PocketLab Voyager's light sensor was used in an earlier lesson by this author. In this lesson, entitled "PocketLab Voyager: Double Slit Diffraction Interference & The Wavelength of Light", photos are taken of double-slit diffraction patterns from laser light. The photos are then analyzed on a computer screen for the purpose of obtaining intensity values for the pattern of nodes and antinodes. The intensity values obtained are then compared to double-slit diffraction theory.
